EUR/GBP Price Analysis: Sellers stepped in around 0.8780s, eyeing a break below 0.8700
- EUR/GBP dropped after failing to break above the 0.8787 area.
- The EUR/GBP daily chart remains upward biased, but a negative divergence is looming, having risks skewed to the downside.
- In the short term, the EUR/GBP is already downward biased and could break below the 0.8700 mark.
The EUR/GBP dropped from daily highs after hitting a YTD high on Monday at 0.8787. Still, renewed fears of tensions arising between Ukraine and Russia weighed on the shared currency, which is trading below its opening price by 0.41% on Wednesday. At the time of writing, the EUR/GBP is trading at 0.8719.
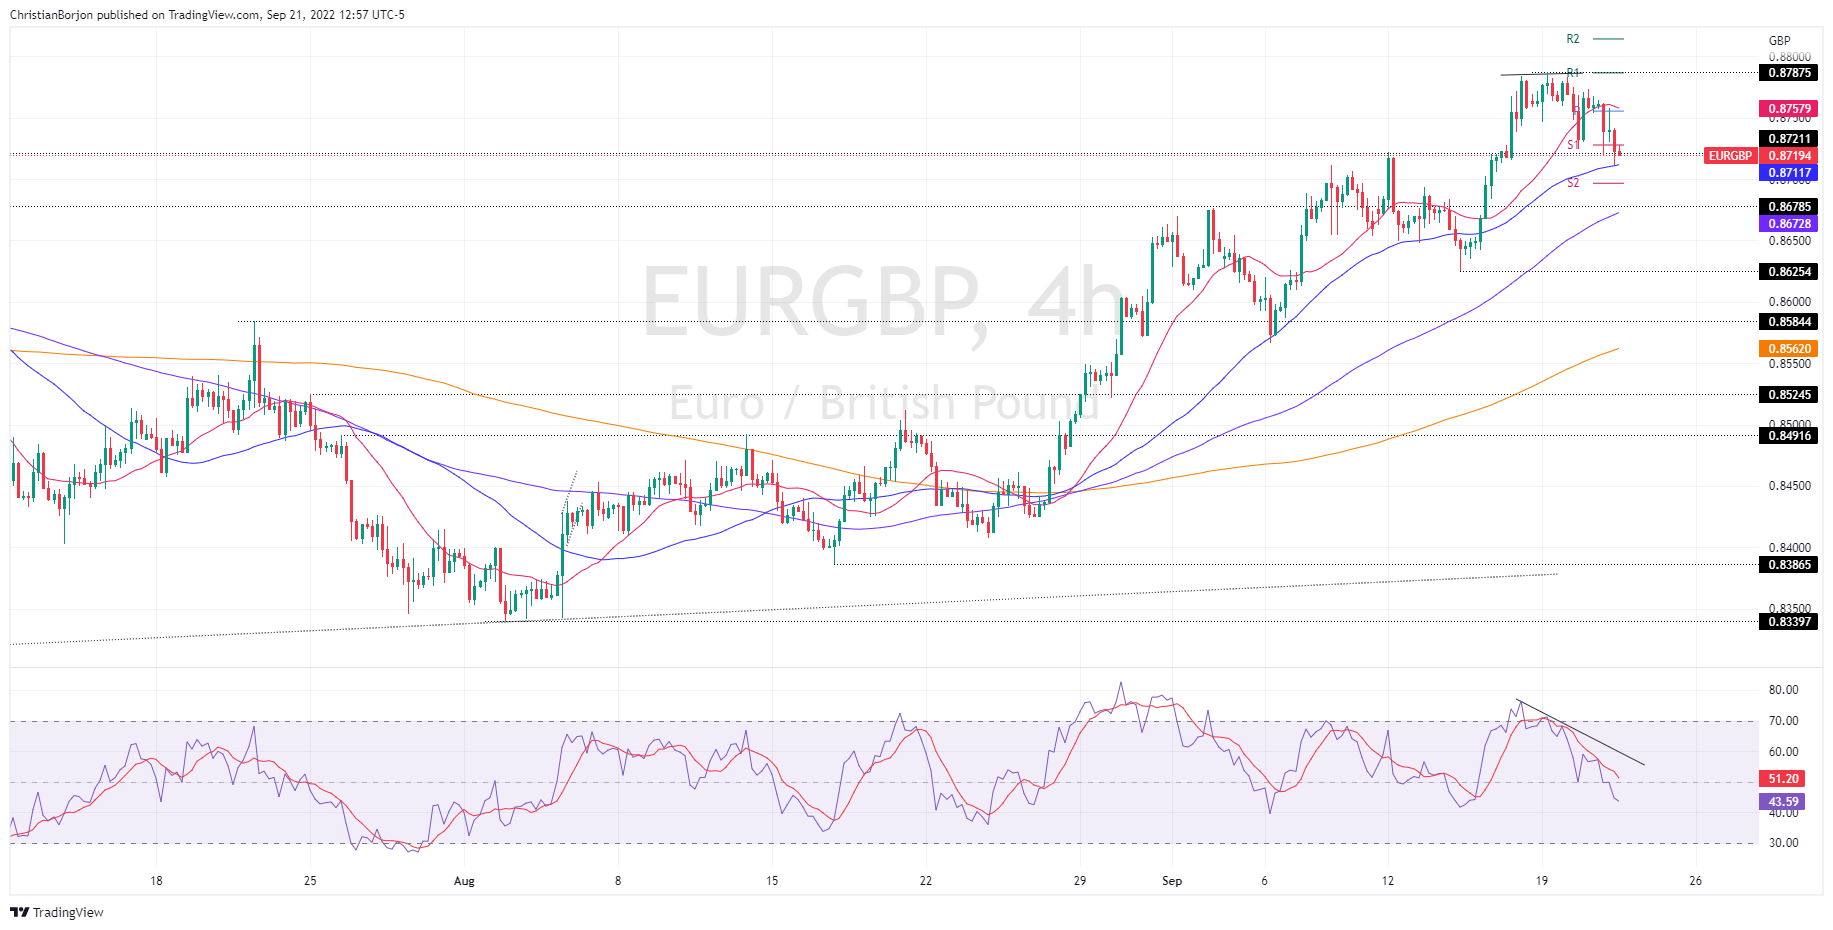
EUR/GBP Price Analysis: Technical outlook
The EUR/GBP daily chart illustrates the cross-currency pair that, albeit tumbling from around YTD highs, the pair encountered support above the June 15 daily high at 0.8721. During the day, the EUR/GBP dived towards its daily low at 0.8711, but bids lifted the pair towards current exchange rates. EUR/GBP traders should be aware that a negative divergence is forming, with the EUR/GBP price action registering higher highs, contrary to the RSI, which printed lower lows.
Therefore, in the near term, traders could expect a correction before resuming the uptrend.
Short term, the EUR/GBP is downward biased, as depicted by the 4-hour chart. The negative divergence in this time frame sent the cross sliding below the 20-EMA, but the 50-EMA at 0.8711, was a difficult support level to hurdle. Nevertheless, with the RSI getting into negative territory and further weakness expected by the euro, a fall below the 0.8700 mark is likely.
Therefore, the EUR/GBP first support would be the 50-EMA at 0.8711, which, once cleared, could send the pair sliding towards the S1 pivot at 0.8696. A breach of the latter will expose the 100-EMA at 0.8672, followed by the last week’s low at 0.8625.
EUR/GBP Key Technical Levels