Silver Price Analysis: Mildly offered below $21.00 inside monthly rising wedge
- Silver price retreats from daily top as buyers step back inside a bearish chart pattern.
- RSI suggests further grinding towards the north, 100-DMA adds to the upside filters.
- 50-DMA acts as a validation point for further downside past $20.48 key support.
Silver price (XAG/USD) consolidates recent gains around a six-week high, holding lower ground near $20.80 amid Monday’s Asian session.
In doing so, the bright metal seesaws inside a one-month-old rising wedge bearish chart pattern.
However, the successful trading above the 50-DMA joins the firmer RSI line, not overbought, to keep buyers hopeful.
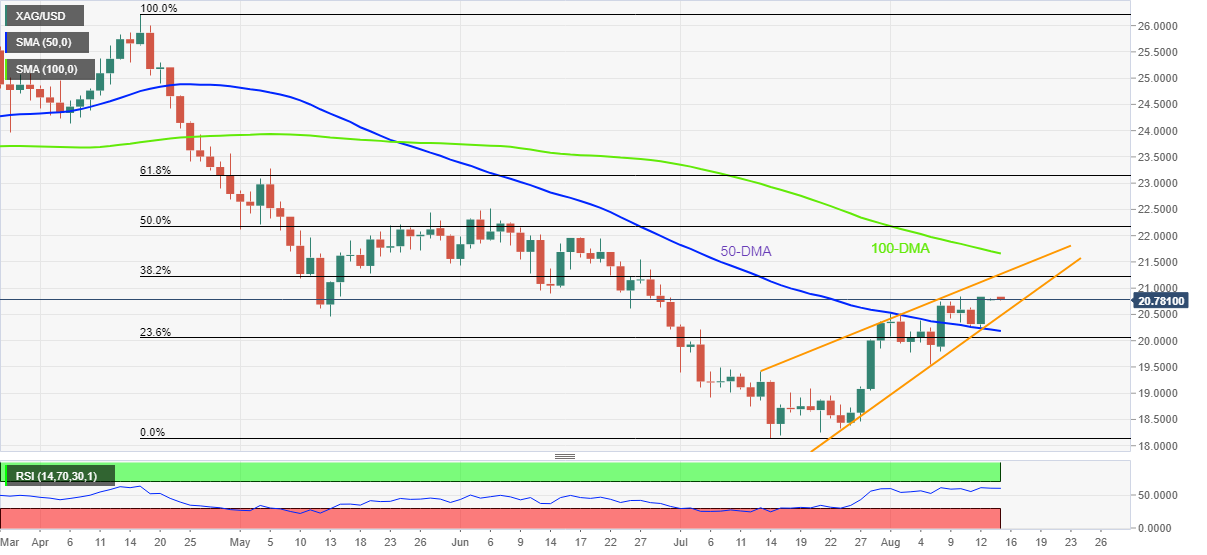
That said, a convergence of the stated wedge’s upper line and the 38.2% Fibonacci retracement level of April-July downside, near $21.20-25, appears a tough nut to crack for the XAG/USD bulls.
Even if the silver buyers manage to cross the $21.25 hurdle, the 100-DMA level near $21.70 could challenge the bullion’s further upside.
Alternatively, a downside break of the $20.50-45 support will confirm the rising wedge breakdown, which in turn suggests (theoretically) a south-run towards $17.80. Though, the 50-DMA level surrounding $20.20 and the $20.00 threshold could test XAG/USD bears.
Also acting as a downside filter is the yearly low near $18.15.
Silver: Daily chart
Trend: Limited upside expected