GBP/USD Price Analysis: Pullback remains elusive above 50-DMA near 1.2200
- GBP/USD grinds higher after refreshing the monthly peak the previous day.
- Bullish MACD signals, sustained break of 50-DMA favor buyers.
- Previous resistance line from February, two-week-old support trend line add to the downside filters.
- 38.2% Fibonacci retracement, 100-DMA lures buyers ahead of May’s top.
GBP/USD bulls struggle to keep reins around the monthly top during early Tuesday morning in Europe. That said, the Cable pair takes rounds to 1.2250-60 by the press time.
Even so, the pair buyers remain hopeful amid the bullish MACD signals and a clear upside break of the descending trend line from February, as well as the 50-DMA.
It’s worth noting that the pair’s declines below the 50-DMA and the resistance-turned-support line, respectively around 1.2200 and 1.2140, need validation from a fortnight-long support line, close to 1.2090 by the press time, to convince GBP/USD bears.
Following that, a downward trajectory towards June’s low of 1.1933 and the recent multi-month bottom surrounding 1.1760 can’t be ruled out.
On the contrary, the GBP/USD pair’s further upside could aim for the mid-June swing high near 1.2410.
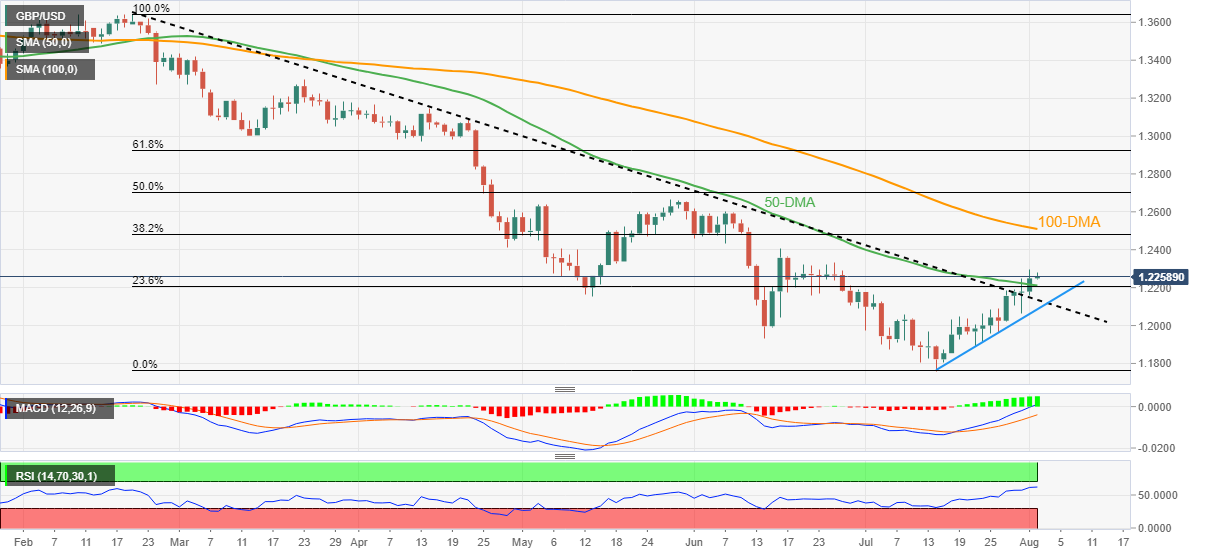
However, the 38.2% Fibonacci retracement level of February-July downside and the 100-DMA, around 1.2485 and 1.2510 in that order, will challenge the pair buyers before directing them to the May month high of 1.2669.
GBP/USD: Daily chart
Trend: Further upside expected