NZD/USD Price Analysis: Extends 100-DMA breakdown towards 0.6985
- NZD/USD takes offers to refresh monthly low, down for the fourth consecutive day.
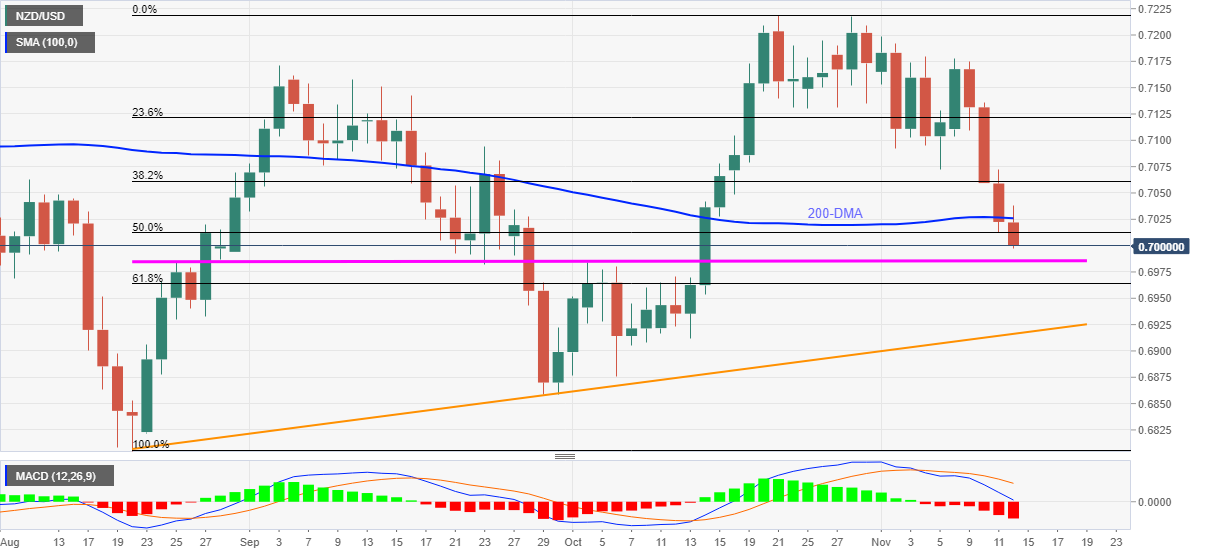
- 11-week-old horizontal support, 61.8% Fibonacci retracement level on the bear’s radar.
NZD/USD stays offered for the fourth day in a row, refreshing monthly low around 0.6995 during early Friday.
In doing so, the kiwi pair extends the downside break of the 200-DMA and 50% Fibonacci retracement (Fibo.) of August-October upside amid bearish MACD signals.
That being said, the NZD/USD prices are en route to the 61.8% Fibo. near 0.6965. However, a horizontal line comprising multiple levels since August 25, around 0.6985 may challenge the immediate declines.
Should the quote drop below 0.6965, a three-month-old ascending trend line near .6915 will be crucial.
Alternatively, a clear upside break of the 100-DMA level of 0.7025 will aim for the November 05 low of 0.7072 and the 0.7100 threshold.
However, September’s peak surrounding 0.7170 and the 0.7200 round figure will test the NZD/USD bulls afterward.
NZD/USD: Daily chart
Trend: Further weakness expected