Gold Price Forecast: XAU/USD eyes a pre-Fed bumpy ride to $1805 – Confluence Detector
- Gold price clings to the previous recovery gains below $1800.
- Falling shorter-duration yields offer support to gold price.
- XAU/USD’s drop below $1,780 an ominous sign ahead of Fed.
Gold is moving back and forth in narrow range so far this Tuesday, holding onto the previous recovery gains amid a cautious market mood. The US dollar is trading broadly subdued amid a sell-off in the shorter-duration Treasury yields, benefitting the non-yielding gold. Investors believe that the Fed will announce tapering on Wednesday but may push back the expectations of rate hikes. Looking ahead, the pre-Fed anxiety and the dynamics in the yields will continue to play amid a data-light US docket.
Read: Gold Price Forecast: XAU/USD awaits acceptance above this key hurdle, as Fed meet kicks off
Gold Price: Key levels to watch
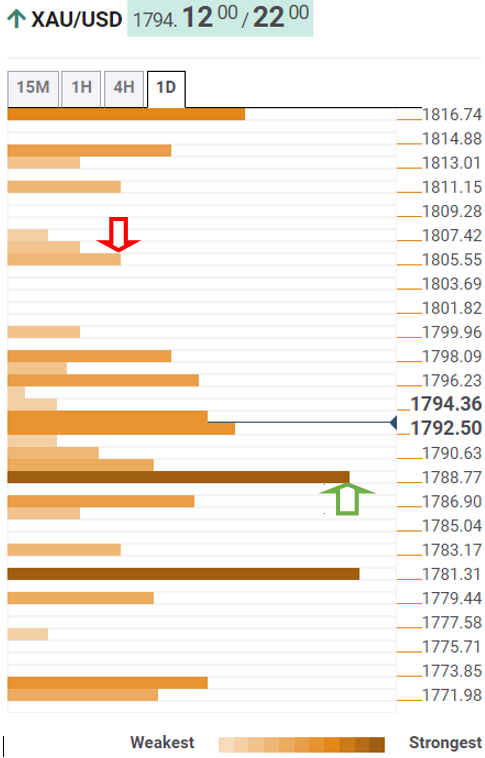
The Technical Confluences Detector shows that gold is looking to recapture the previous day’s high of $1796 on its upward march. The Fibonacci 61.8% one-week coincides at that level.
Immediate upside barrier appears at $1798, which is the Fibonacci 23.6% one-month. Acceptance above the latter will fuel a sharp rally towards $1805, the intersection of the pivot point one-week R1 and pivot point one-day R2.
Further up, the previous week’s high of $1810 will be the level to beat for gold bulls.
Meanwhile, the SMA200 one-day at $1792 will cap any pullback in gold price.
The next strong support awaits at $1789, where the Fibonacci 38.2% one-month and SMA10 four-hour intersect.
The confluence of the SMA100 one-day and Fibonacci 38.2% one-week at $1786 will then be on the sellers’ sights.
The SMA50 one-day at $1782 is the last line of defense for gold buyers.
Here is how it looks on the tool
About Technical Confluences Detector
The TCD (Technical Confluences Detector) is a tool to locate and point out those price levels where there is a congestion of indicators, moving averages, Fibonacci levels, Pivot Points, etc. If you are a short-term trader, you will find entry points for counter-trend strategies and hunt a few points at a time. If you are a medium-to-long-term trader, this tool will allow you to know in advance the price levels where a medium-to-long-term trend may stop and rest, where to unwind positions, or where to increase your position size.