US Dollar Index Price Analysis: Bulls can ignore DXY pullback below 200-SMA
- DXY eases from one-week high but keeps the trend line breakout.
- Firmer Momentum, sustained trading beyond six-week-old support line keeps buyers hopeful.
US Dollar Index (DXY) refreshes intraday low to 92.52 while probing a two-day uptrend during early Wednesday.
The greenback gauge jumped the most since August 19 the previous day, crossing a three-week-old resistance line, now support, amid upbeat Momentum.
However, DXY bulls seem to take a breather before challenging another key resistance, namely the 200-SMA level of 92.65 at the latest.
Even so, the quote holds onto the previous day’s breakout, also staying past an ascending support lien from July 30, to favor optimists.
Hence, a clear upside break of 92.65 becomes necessary for the US Dollar Index to aim for the 93.00 threshold and the August 11 peak near 93.20. Following that, the last month’s high near 93.72 will gain the market’s attention.
On the contrary, a downside break of the previous resistance line near 92.35 will redirect DXY towards the broader support line close to 92.10.
In a case where the greenback bears dominate past 92.10, they need to conquer the 92.00 round figure before targeting July’s low near 91.78.
DXY: Four-hour chart
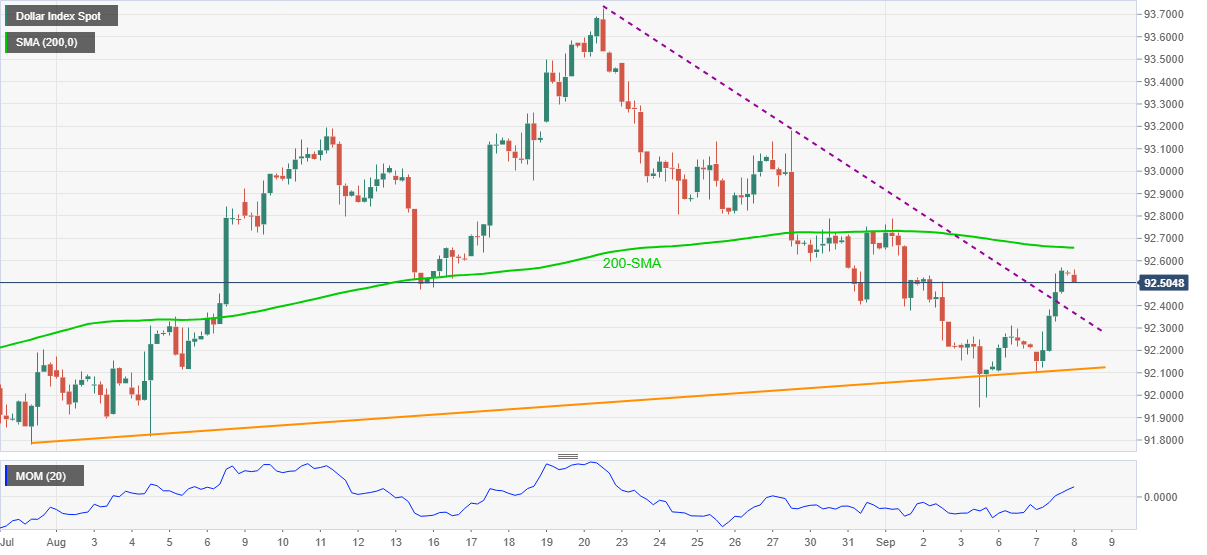
Trend: Further upside expected