Gold Price Forecast: XAU/USD has room to fall towards $1744 – Confluence Detector
- Gold is attempting a dead cat bounce amid firmer US dollar.
- Fed’s hawkishness and Delta variant concerns boost the greenback.
- Gold Weekly Forecast: Sellers look to retain control following uninspiring rebound
Gold price is licking its wound following Tuesday’s sharp sell-off to two-month lows of $175. The US dollar extended the recent rally, as risk-off sentiment flared up on the renewed concerns over the coronavirus pandemic and its impact on the global economic recovery, in the face of the rapid spread of the Delta covid variant. The greenback also took advantage of the Fed’s hawkish tilt, as a "very optimistic" Fed Governor Christopher Waller said that the world’s most powerful central bank could resort to QE unwinding as soon as this year while hike rates in late 2022. Gold’s appeal gets diminished amid a firmer dollar.
Attention now turns towards the key US jobs data, with the leading indicator – ADP due for release at 1215 GMT. However, gold’s next direction could be determined by Friday’s all-important US NFP report.
Read: ADP Nonfarm Payrolls Preview: Going contrarian? How to trade this leading indicator
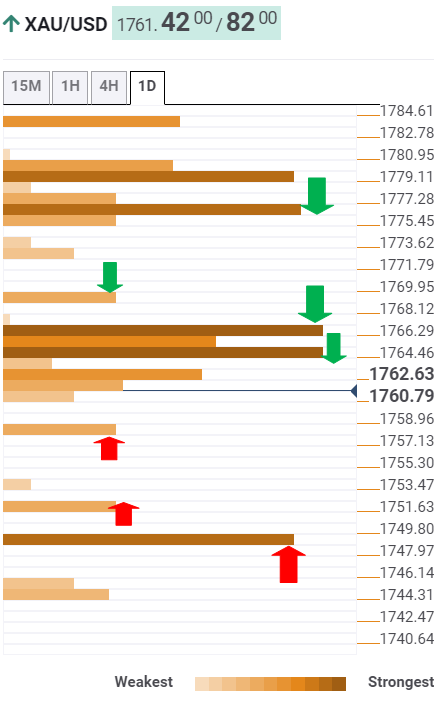
Gold Price: Key levels to watch
The Technical Confluences Detector shows that gold price is trading below a cluster of power resistance levels, with the immediate one seen at $1764, the previous week’s low.
The confluence of the previous month’s low and SMA5 four-hour at $1766 will be the next barrier for gold bulls.
Further up, the Fibonacci 61.8% one-day at $1769 will guard the upside. If the buying interest ramps up, gold price could advance towards $1776, the convergence of the Fibonacci 61.8% one-week and SMA100 one-hour.
On the flip side, the Fibonacci 23.6% one-day at $1758 could cap immediate decline, below which the two-month lows of $1751 could be retested.
The intersection of the pivot point one-day S1 and pivot point one-week S2 at $1748 will challenge the bearish commitments.
Sellers could then target the Fibonacci 161.8% one week at $1744 should the abovementioned strong support give way.
Here is how it looks on the tool
About Technical Confluences Detector
The TCD (Technical Confluences Detector) is a tool to locate and point out those price levels where there is a congestion of indicators, moving averages, Fibonacci levels, Pivot Points, etc. If you are a short-term trader, you will find entry points for counter-trend strategies and hunt a few points at a time. If you are a medium-to-long-term trader, this tool will allow you to know in advance the price levels where a medium-to-long-term trend may stop and rest, where to unwind positions, or where to increase your position size.