AUD/USD Price Analysis: Targets 0.7685 after triangle breakdown
- AUD/USD risks further falls as risk-aversion boosts DXY demand.
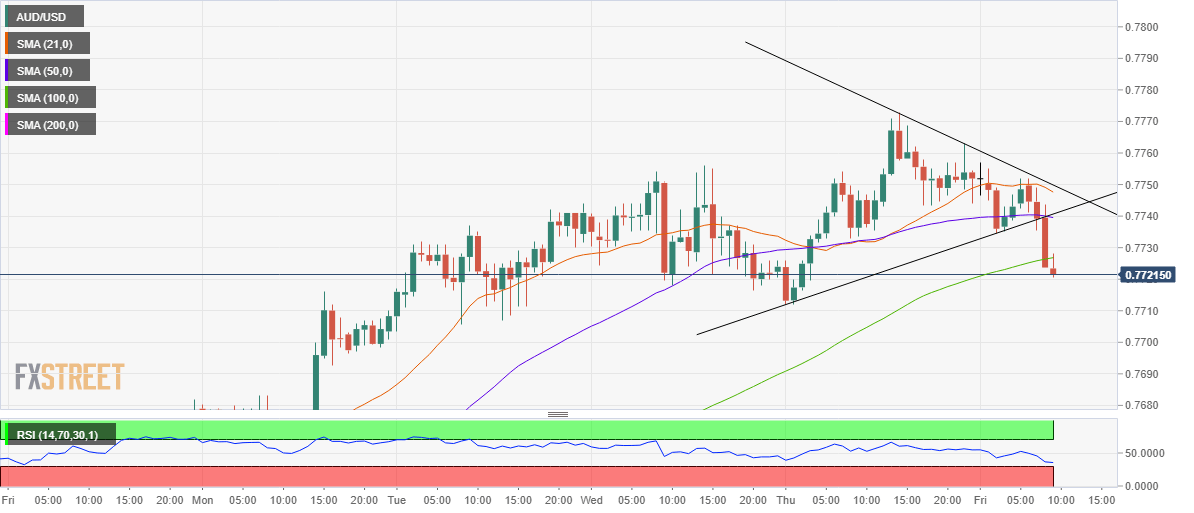
- The 1H chart confirms symmetrical triangle breakdown
- Bearish RSI suggests more losses below 100-HMA support.
AUD/USD extends its bearish momentum towards 0.7700, having failed to find a foothold above 0.7750 on several occasions.
The selling pressure behind the aussie is mainly driven by the broad-based US dollar recovery from two-week troughs, as the risk-off market mood boosts the haven demand for the greenback.
Amid the downbeat market mood, the S&P 500 futures have dropped nearly half a percent, also adding to the weight on the higher-yielding aussie.
From a short-term technical perspective, the path of least resistance to the downside for the spot, especially after it charted a triangle breakdown on the hourly sticks.
Adding credence to the further downside, the critical 100-hourly moving average (HMA) support at 0.7726 has given way, opening floors for a test of the 0.7700 psychological magnate.
Further south, the pattern target measured at 0.7686 could come into play. The Relative Strength Index (RSI) hangs near lows below the midline, currently at 35.72, allowing room for more declines.
On the flip side, the AUD bulls need to regain the 100-HMA support now resistance in order to extend the recovery momentum towards a strong barrier at 0.7740. That level is the confluence of the horizontal 50-HMA and pattern support now resistance.
The next hurdle for the buyers is seen at the bearish 21-HMA, now at 0.7748.
AUD/USD: Hourly chart
AUD/USD: Additional levels