GBP/USD Price Analysis: Evening star below 200-HMA probes bulls attacking 1.3700
- GBP/USD battles intraday top while extending pullback from 1.3655.
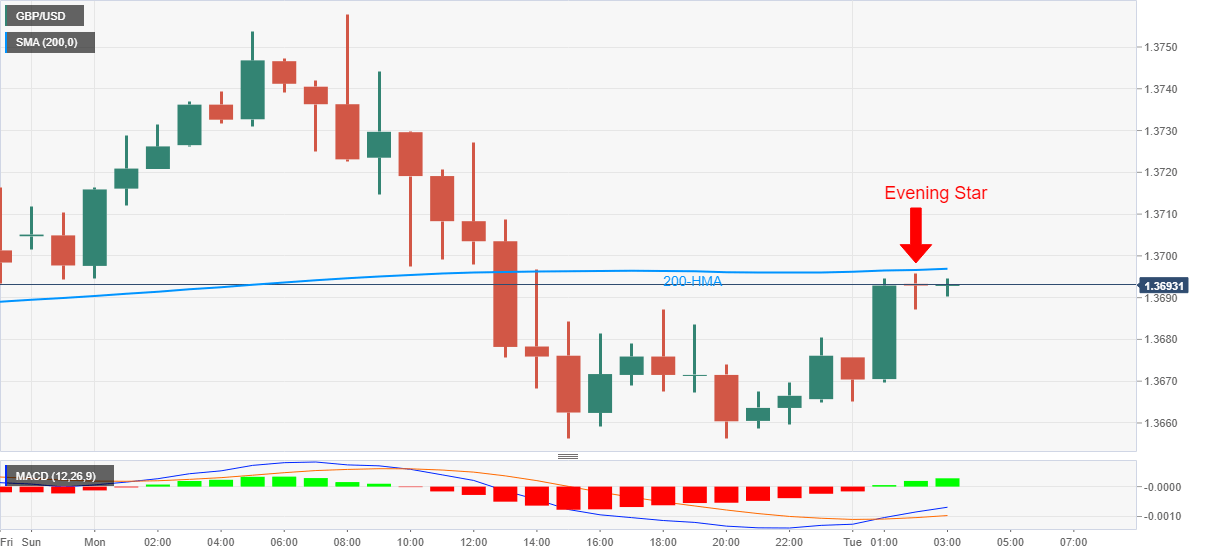
- Bearish candlestick, key HMA suggest pullback moves but bullish MACD tests the seller’s entry.
GBP/USD wavers around an intraday high of 1.3695 during early Tuesday. In doing so the quote stays below 200-HMA while flashing the ‘evening star’ candlestick on the hourly (1H) chart off-late.
Considering the bearish candlestick and the failures to cross 200-HMA, GBP/USD is up for a pullback towards the mid-1.3600s.
However, bullish MACD signals keep favoring the buyers targeting the recent multi-month top surrounding 1.3755-60.
In a case where the GBP/USD buyers manage to cross 1.3760, April 30, 2018 peak surrounding 1.3792 and the 1.3800 could challenge the quote’s further upside.
It should also be noted that the pair’s weakness past-1.3650 may direct GBP/USD sellers toward the 1.3600 round-figure before highlighting the January 18 low near 1.3520.
GBP/USD hourly chart
Trend: Pullback expected