WTI Price Analysis: Teasing triangle breakout on 1H chart ahead of OPEC+ meeting
- WTI looks north amid a likely descending triangle on hourly charts.
- Vaccine optimism eases economic growth and oil demand concerns.
- All eyes on OPEC+ meeting and API weekly US crude stocks data.
WTI (futures on NYMEX) has caught a fresh bid wave over the last hour, as it looks to regain the $42 level amid expectations that the OPEC and its allies (OPEC+) will delay the oil output hike by three to six months when they meet later on Tuesday.
Further, the optimism over a quicker economic turnaround and in turn improved prospects for oil demand, flagged by the encouraging covid vaccine news, also continue to support the black gold.
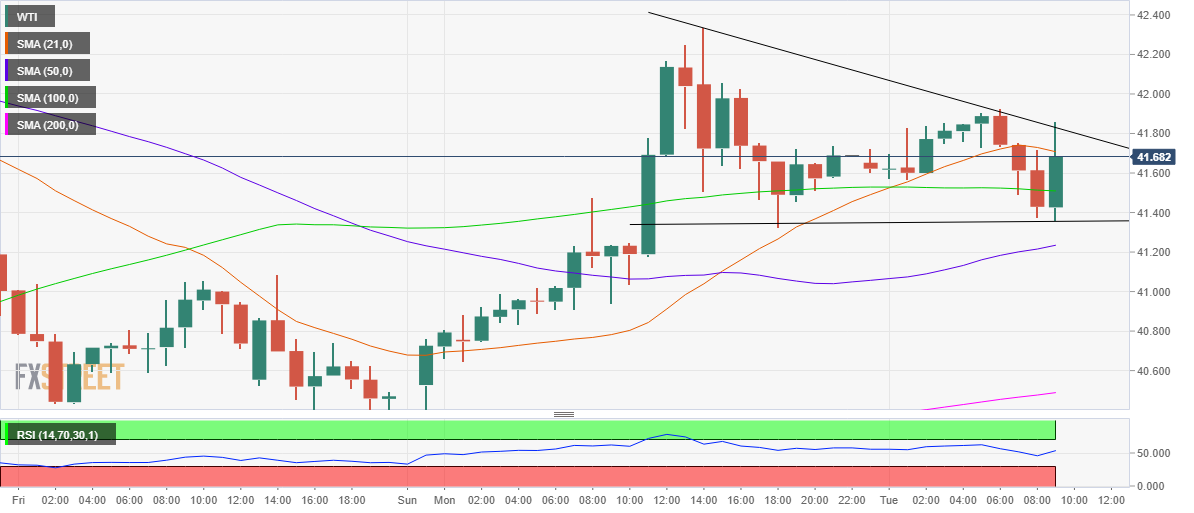
From a short-term technical perspective, the price is consolidating after Monday’s rally, carving out a descending triangle formation on the hourly chart.
The pattern will get validated on an hourly closing above the falling trendline resistance, currently at $41.83.
Acceptance above the latter could call for a test of the previous day’s high at $42.34, with eyes on the $43 level.
The hourly Relative Strength Index (RSI) is advancing further above the midline, allowing for additional upside.
On the flip side, a breach of the horizontal trendline support at $41.36 will invalidate the pattern, opening floors towards the upward-sloping 50-hourly moving average (HMA) at $41.23.
WTI hourly chart
WTI additional levels