GBP/USD Price Analysis: Struggles to carry 200-day SMA break beyond 1.2700
- GBP/USD takes rounds to the lower end of 1.2722-43 trading range.
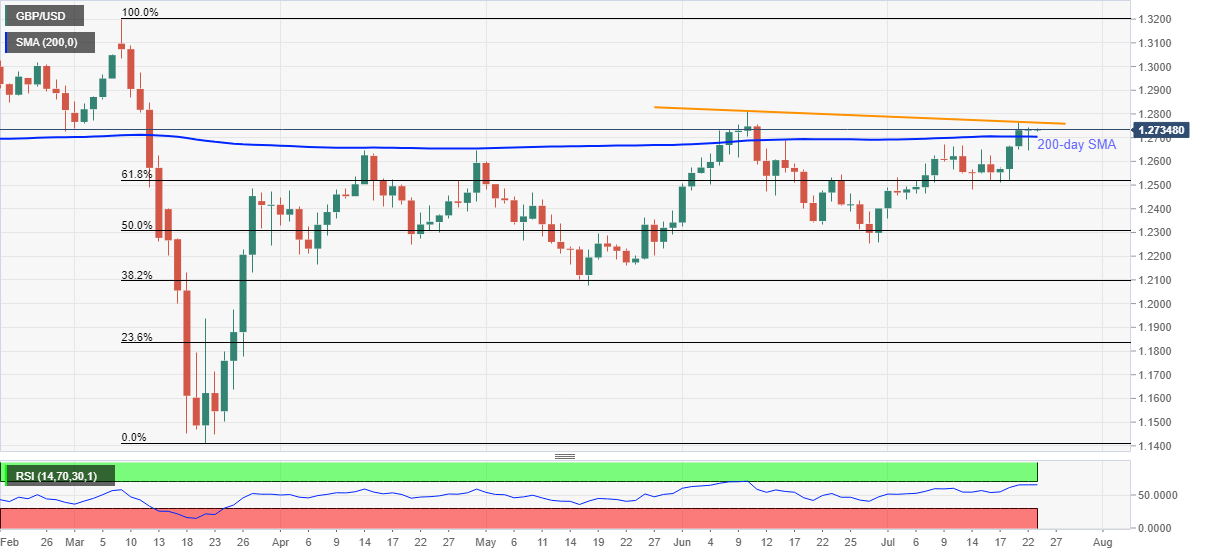
- Overbought RSI, a six-week-old resistance line questions the bulls.
- Sellers may aim for 61.8% Fibonacci retracement on the 200-day SMA breakdown.
GBP/USD drops to 1.2730 during the initial Asian session on Thursday. The cable fails to extend its rise past-200-day SMA breakout amid overbought RSI conditions. As a result, a downward sloping trend line from June 10 becomes the key to watch.
Should the quote manages to cross 1.2765 resistance, it can quickly attack the 1.2800 threshold before targeting June month’s top near 1.2815.
Furthermore, 1.2880/85 can offer an intermediate halt during the quote’s additional north-run towards 1.3000 psychological magnet.
Meanwhile, a downside break of a 200-day SMA level of 1.2700 will recall 61.8% Fibonacci retracement of March month’s fall near 1.2520.
In a case bears refrain from backing down around 1.2520, 1.2500 and June 29 low around 1.2250 will gain the market attention.
GBP/USD daily chart
Trend: Pullback expected