Gold Price Analysis: Eyeing $1,861 after jumping above $1,840 – Confluence Detector
Gold is surging to new highs and has already topped $1,840 – the highest since September 2011. How is XAU/USD positioned on the chart?
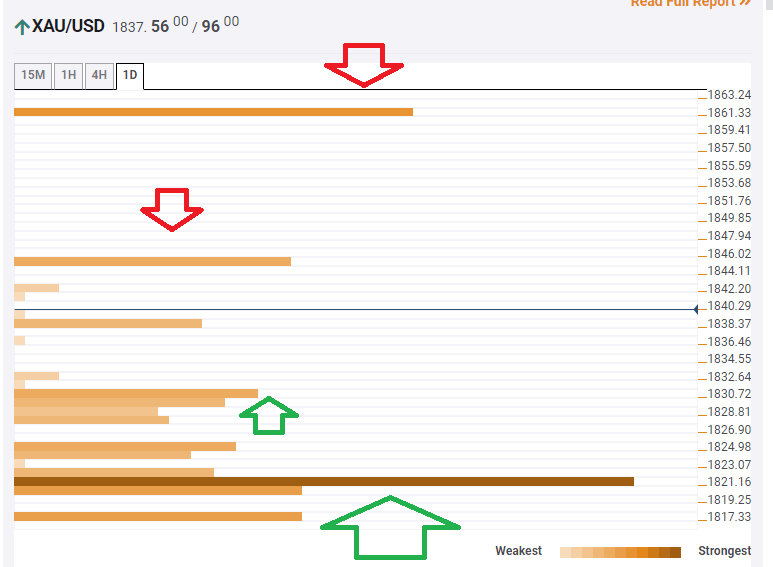
The Technical Confluences Indicator is showing that the next resistance line for gold is at $1,844, which is where the Pivot Point one-week Resistance 3 hits the price.
The high target is $1,861, where another pivot point awaits – the one month Resistance 2.
Looking down, initial support is at $1,830, which is the convergence of the Simple Moving Average 5-1h, the previous 4h-high, and the PP one-week R2.
A more considerable cushion is at $1,821, which is the confluence of the previous daily high, the PP one-month R1, the Bollinger Band 1h-Middle, the SMA 10015m, and the PP one-week R1.
Here is how it looks on the tool:
Confluence Detector
The Confluence Detector finds exciting opportunities using Technical Confluences. The TC is a tool to locate and point out those price levels where there is a congestion of indicators, moving averages, Fibonacci levels, Pivot Points, etc. Knowing where these congestion points are located is very useful for the trader, and can be used as a basis for different strategies.
This tool assigns a certain amount of “weight” to each indicator, and this “weight” can influence adjacents price levels. These weightings mean that one price level without any indicator or moving average but under the influence of two “strongly weighted” levels accumulate more resistance than their neighbors. In these cases, the tool signals resistance in apparently empty areas.
Learn more about Technical Confluence