USD/CHF Price Analysis: 61.8% Fibonacci retracement on the bears’ radars
- USD/CHF struggles for a firm direction after posting two-day losing streak.
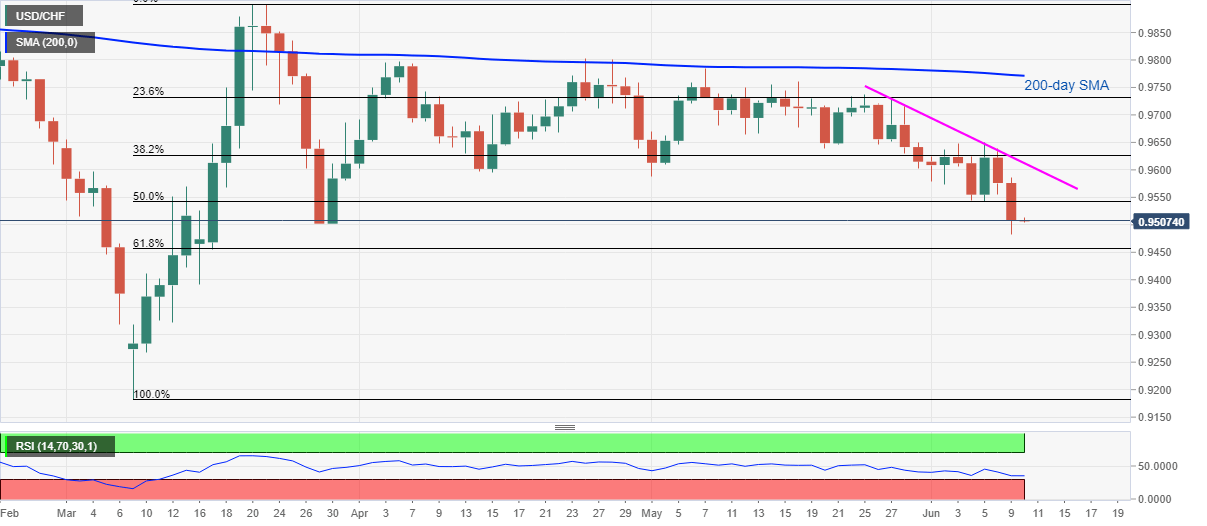
- A sustained break below 50% Fibonacci retracement, short-term falling trend line keep sellers hopeful.
- 200-day SMA acts as the tough nut to crack for buyers.
USD/CHF retreats from intraday high of 0.9515 to 0.9513 amid the Asian session on Wednesday. Even so, the pair registers only a 0.05% price change following its declines since Monday. Though, the bears cheer the quote’s trading below 50% Fibonacci retracement level of March month upside.
Hence, 61.8% Fibonacci retracement level of 0.9457 seems to lure the short-term sellers. It should, however, be noted that oversold RSI conditions might restrict the pair’s downside below the key Fibonacci retracement.
If at all the USD/CHF prices remain weak past-0.9457, March 09 high around 0.9320 and the March month’s low close to 0.9180 could lure the bears.
On the contrary, buyers may look for entries beyond a short-term descending trend line from May 27, at 0.9612 now. In doing so, May 20 low near 0.9640 and 200-day SMA level of 0.9771 could become their following targets.
USD/CHF daily chart
Trend: Further weakness anticipated