GBP/USD Price Analysis: Fails to keep gains from 200-day EMA, still above 1.2700
- GBP/USD recedes the recovery moves from 1.2618 while stepping back from 1.2746.
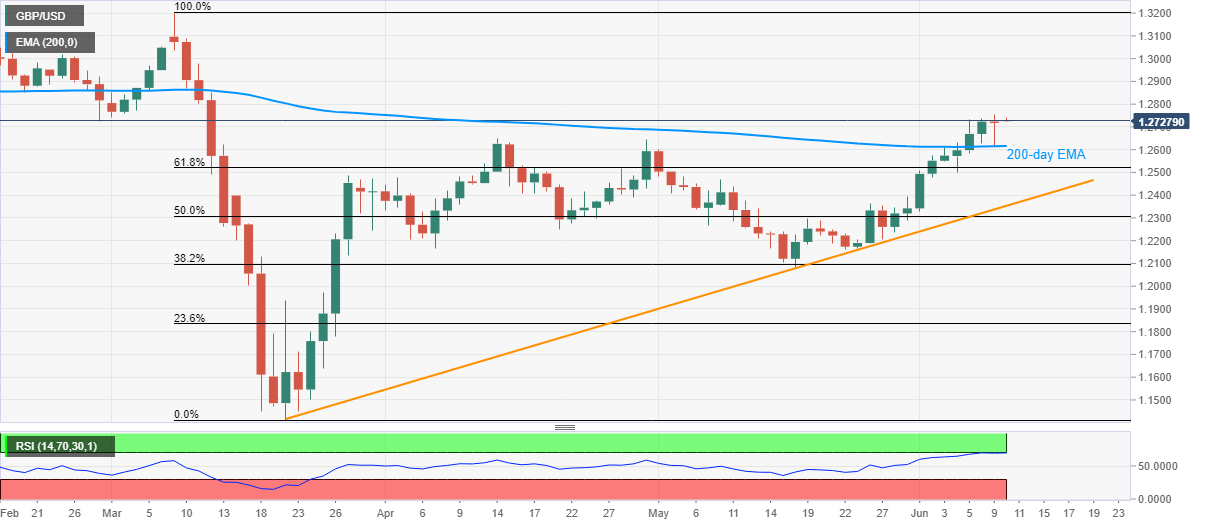
- Overbought RSI keeps the sellers hopeful to revisit 200-day EMA.
- 61.8% Fibonacci retracement, an ascending trend line from March 20 add to the support.
GBP/USD drops to 1.2724 amid the initial Asian trading on Wednesday. In doing so, the pair fails to keep its pullback moves from 200-day EMA amid overbought RSI conditions.
As a result, the sellers may once again aim for the key EMA level near 1.2615 during the further downside. However, 61.8% Fibonacci retracement level of the pair’s March month declines, around 1.2520, could restrict the quote’s further weakness.
In a case where the bears remain dominant past-1.2520, an ascending trend line from late-March, currently near 1.2350, will be the key to watch.
Alternatively, a daily closing beyond Tuesday’s high of 1.2756 could escalate the GBP/USD pair’s north-run towards 1.2800 round-figures. Though, the bulls are likely to pause during additional upside beyond 1.2800 unless witnessing a strong fundamental boost.
GBP/USD daily chart
Trend: Pullback expected