Back
9 Dec 2019
USD/INR price analysis: Greenback losing strength against Indian Rupee, challenges 71.00 handle
- USD/INR loses momentum below the 71.20 level.
- USD/IR can decline towards the 70.50 level in the medium term
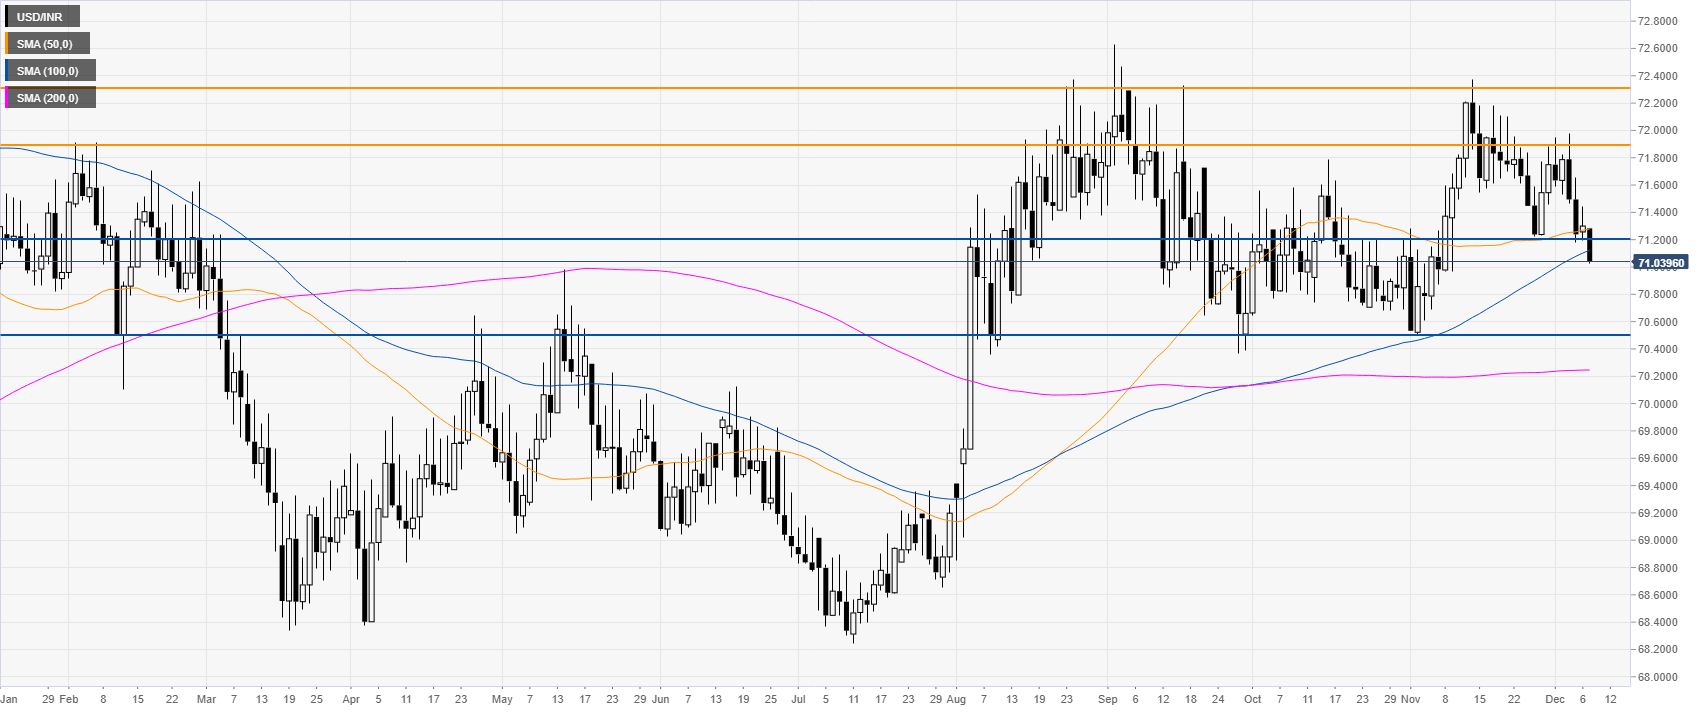
USD/INR daily chart
USD/INR is trading sideways above the 200-day simple moving averages (DMA) but below the 50/100 DMAs. The market broke below the 71.20 swing low, opening the doors for a potential move down to the 70.50 level.
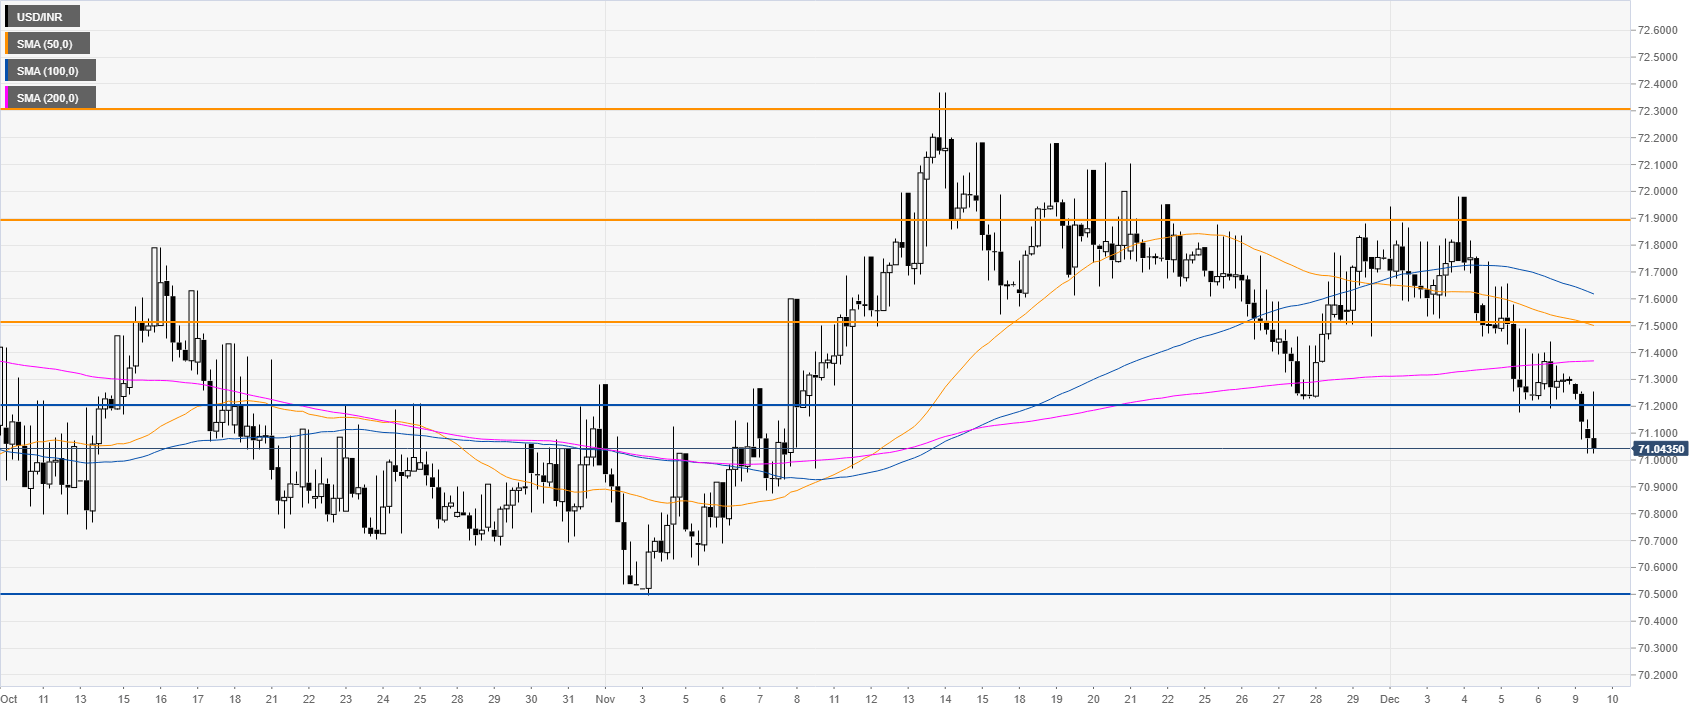
USD/INR four-hour chart
The spot is trading below its main SMAs suggesting a bearish bias in the medium term. Resistances are seen at the 71.50 and 71.90 price levels.
Additional key levels