GBP/USD Technical Analysis: 10-day SMA offers nearby support inside multi-week-old triangle
- GBP/USD bounces off 10-day SMA, stays inside the six-week-old symmetrical triangle.
- An upside break of the triangle needs validation from 1.3000 psychological magnet.
- Sellers can aim for 38.2% Fibonacci retracement during the pair’s drop beneath the technical pattern.
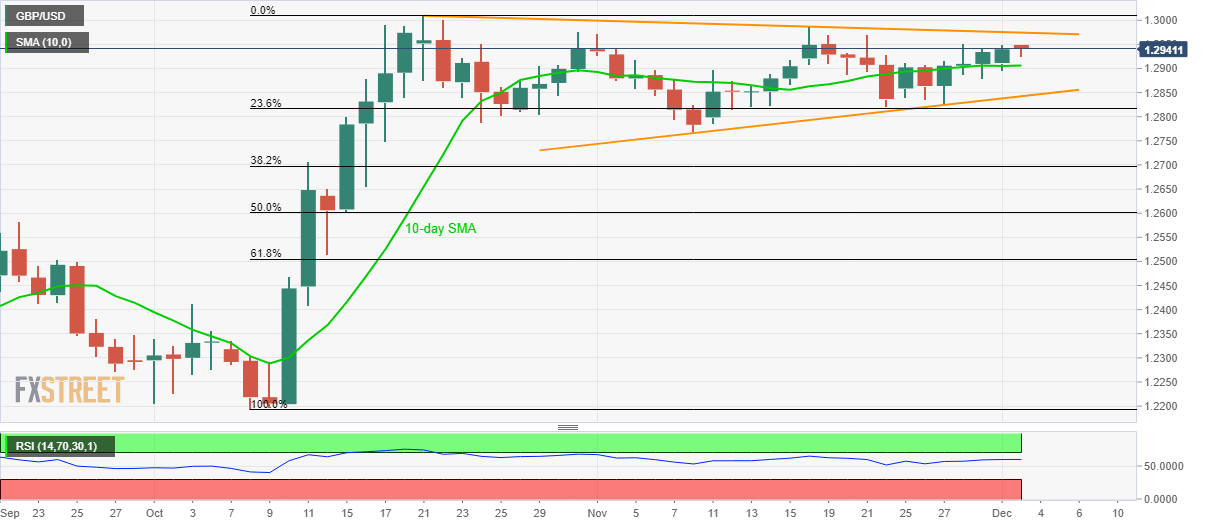
While holding tightly above the 10-day Simple Moving Average (SMA), GBP/USD takes the rounds to 1.2940 during Tuesday's Asian session. Even so, the pair remains inside a multi-week-old triangle formation.
That said, the pattern’s resistance line around 1.2975 acts as an immediate upside barrier holding the key to the pair’s run-up towards 1.3000 round-figure.
However, a sustained rise beyond the same might not refrain from challenging the May month tops surrounding 1.3180.
Alternatively, pair’s downside below 10-day SMA level of 1.2906 could trigger fresh pullback towards the triangle’s support line, near 1.2840.
In a case where prices defy the triangle formation with a break beneath 1.2840, 38.2% Fibonacci retracement level of October month upside close to 1.2700 will be on the Bears’ radar.
GBP/USD daily chart
Trend: Sideways