Back
5 Nov 2019
USD/CAD technical analysis: 100-HMA, 1.3127/25 keep buyers hopeful
- USD/CAD stays above near-term key supports despite the recent pullback.
- Buyers will look for entry beyond 1.3185.
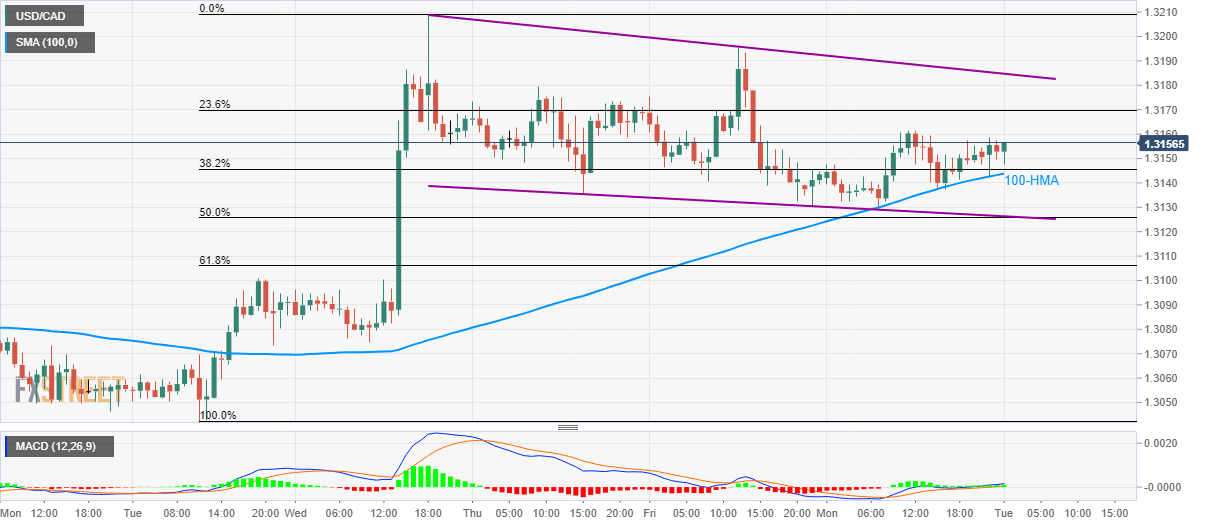
With sustained trading beyond 100-hour Simple Moving Average (100-HMA), USD/CAD seesaws around 1.3155 during the Asian session on Tuesday.
In addition to a 100-HMA level of 1.3143, 50% Fibonacci retracement of late-October rise and a falling trend line since Thursday, near 1.3125/27, could restrict pair’s near-term declines.
Should there be an extended weakness below 1.3125, October 29 high of 1.3100 and 1.3042 will lure bears.
On the upside, buyers will wait for a clear break of a falling resistance line since Wednesday, at 1.3185, to target 1.3210 and mid-October highs near 1.3250.
USD/CAD hourly chart
Trend: pullback expected