USD/IDR technical analysis: Weak below 50-day SMA, 14,160/62 becomes the key resistance
- USD/IDR stays under 50-day SMA since it dropped below the same two weeks ago.
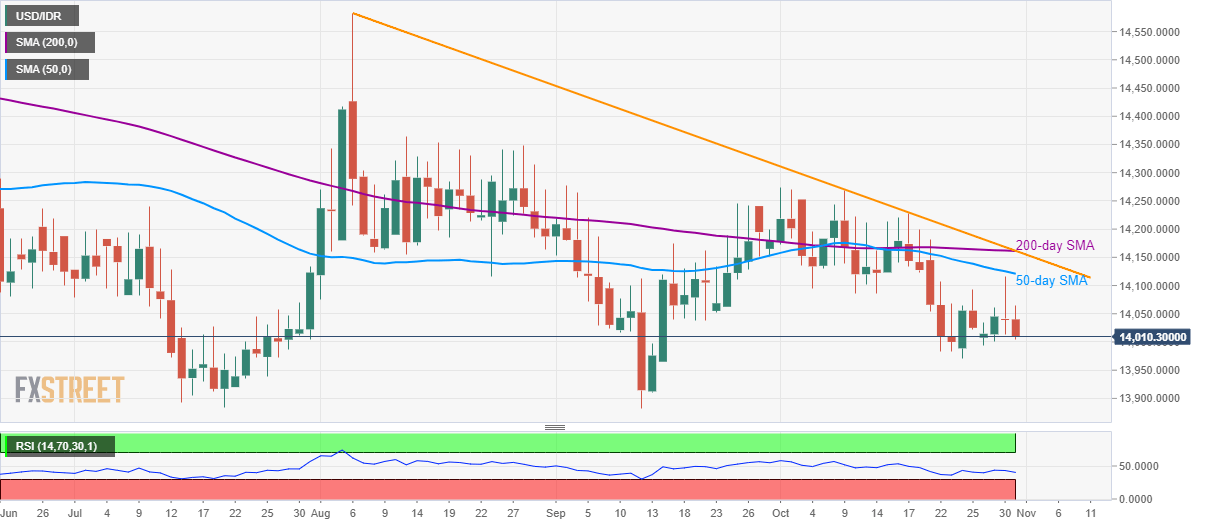
- 200-day SMA and a falling trend line since early August act as the key upside barrier.
With its sustained trading below 50-day SMA, USD/IDR declines to 14,010 by the press time of the Asian session on Thursday.
The pair now drops towards the monthly low surrounding 13,970 whereas July and September month bottoms around 13,880 could restrict bears then after.
In a case prices keep running downwards past-13,880, June month low near 13,750 will become sellers’ favorite.
On the upside, pair’s rise above 50-day Simple Moving Average (SMA) level of 14,120 will set the tone for the pair’s run-up to 14,160/62 resistance confluence including 200-day SMA and a descending trend line since August 08.
If at all buyers manage to conquer 14,162 on a daily closing basis, odds of a fresh run-up towards the month’s top nearing 14,275 can’t be ignored.
USD/IDR technical analysis
Trend: bearish