Back
30 Oct 2019
GBP/USD technical analysis: Overbought RSI challenges spinning bottom formation
- The GBP/USD pair’s pullback during the last one week seems to reverse amid a bullish candlestick pattern.
- 200-day SMA becomes the key support ahead of September month high.
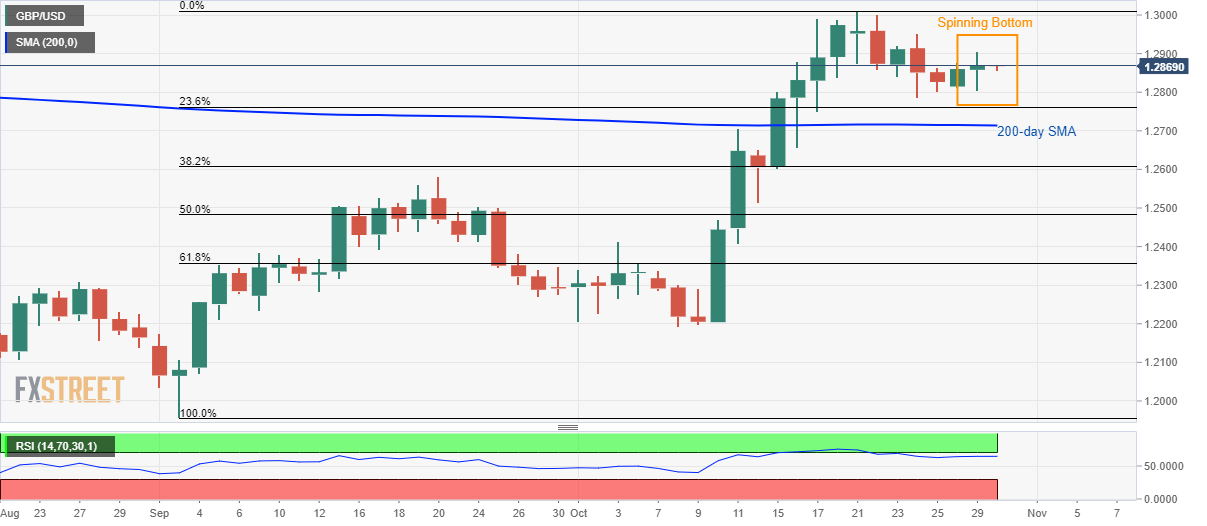
While considering the pair’s momentum since October 21 on a daily (D1) chart, GBP/USD formed a spinning bottom bullish candlestick pattern on Tuesday. Prices are mildly bid around 1.2870 ahead of the London open on Wednesday.
Despite the bullish formation, a shorter time range and pair’s pullback from the multi-month top, not to forget overbought conditions of 14-day Relative Strength Index (RSI), keep the prices in check.
In doing so, the 200-day Simple Moving Average (SMA) level of 1.2714 becomes the key as it holds the gate for September month top of 1.2583.
On the contrary, the pair’s upside needs to cross 1.3000 round-figure, in addition to getting validation from 1.3015, to aim for May month high around 1.3180.
GBP/USD daily chart
Trend: bullish