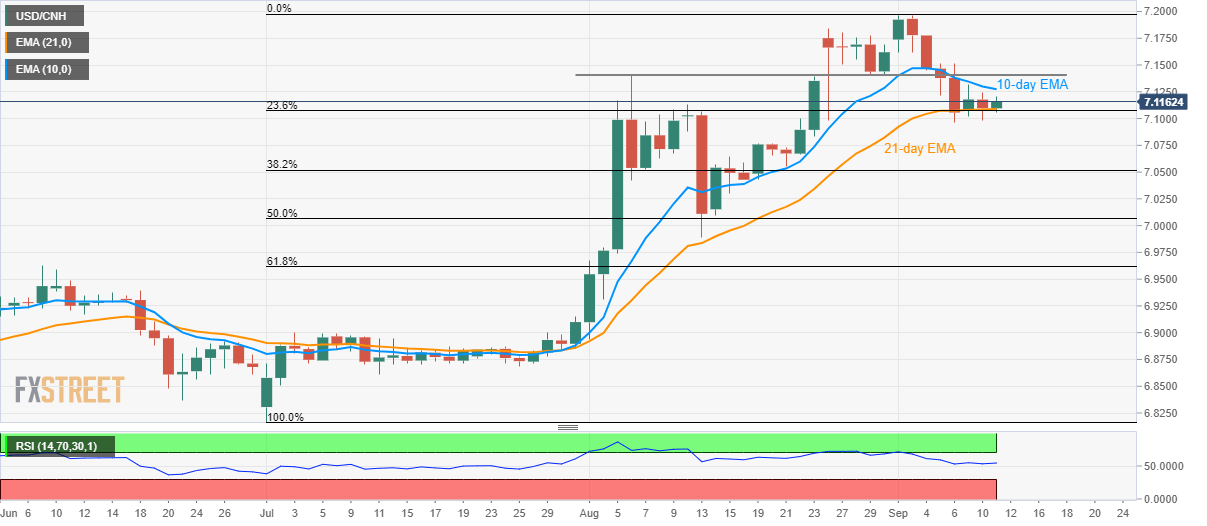
USD/CNH technical analysis: Buyers keep lurking around 23.6% Fibo, 21-day EMA
- USD/CNH remains choppy in a range between key support confluence and 10-day EMA.
- A downside break can drag the quote to 7.0770/65 while 7.1400/10 could challenge the advances beyond short-term EMA.
Despite being above near-term key support-confluence, USD/CNH stays under 10-day exponential moving average (EMA) as it takes rounds to 7.1180 during early Wednesday.
While strong downside support and upbeat levels of 14-day relative strength index (RSI), the pair is more likely to rise past-immediate EMA level of 7.1275 and head towards the five-week-old horizontal area around 7.1400/10.
During the pair’s run-up above 7.1410, 7.1630 and recent high surrounding 7.1970 may entertain buyers ahead of highlighting 7.2000 mark.
On the downside, pair’s break beneath 7.1090/75, including 21-day EMA and 23.6% Fibonacci retracement of July-September upside, can revisit August 19/20 highs surrounding 7.0770/65 whereas 38.2% Fibonacci retracement close to 7.0520 will flash on sellers radar afterward.
USD/CNH daily chart

Trend: sideways
