Back
8 Apr 2019
AUD/NZD Technical Analysis: 1.0520/15 is the level to beat for short-term sellers
AUD/NZD daily chart
- AUD/NZD is trading little negative around 1.0540 during early Monday. The quote rallied to a ten-week high of 1.0575 on Friday.
- 61.8% Fibonacci retracement level of August 2018 to January 2019 downturn, at 1.0600, seems nearby resistance for buyers to aim for during further upside ahead of targeting the year 2019 high near 1.0670 and 200-day simple moving average (SMA) around 1.0700.
- On the downside, 100-day SMA level of 1.0490 and 50% Fibonacci retracement level near 1.0425 could entertain sellers whereas 1.0375 and 1.0340 might appear on their radars afterward.

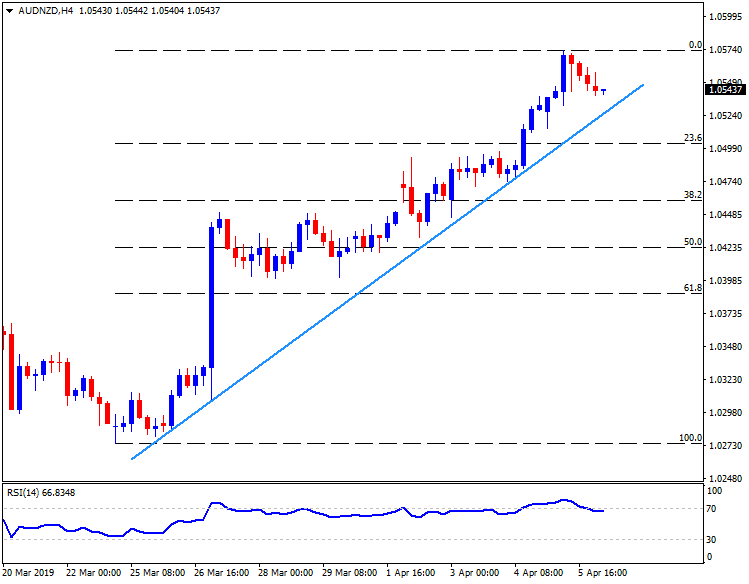
AUD/NZD 4-Hour chart
- An upward sloping trend-line ranging from March 26 can limit immediate declines near 1.0520, a break of which can recall 1.0490 and 1.0450 on the chart.
- 1.0575/80 is likely adjacent resistance to conquer ahead of aiming for 1.0600.
AUD/NZD hourly chart
- 1.0530 could become the closest support contrast to immediate descending trend-line near 1.0560 that can act as nearby resistance.
