Back
30 Mar 2019
S&P500 Technical Analysis: US Stocks ends up the week on their highs near 2,835.00 level
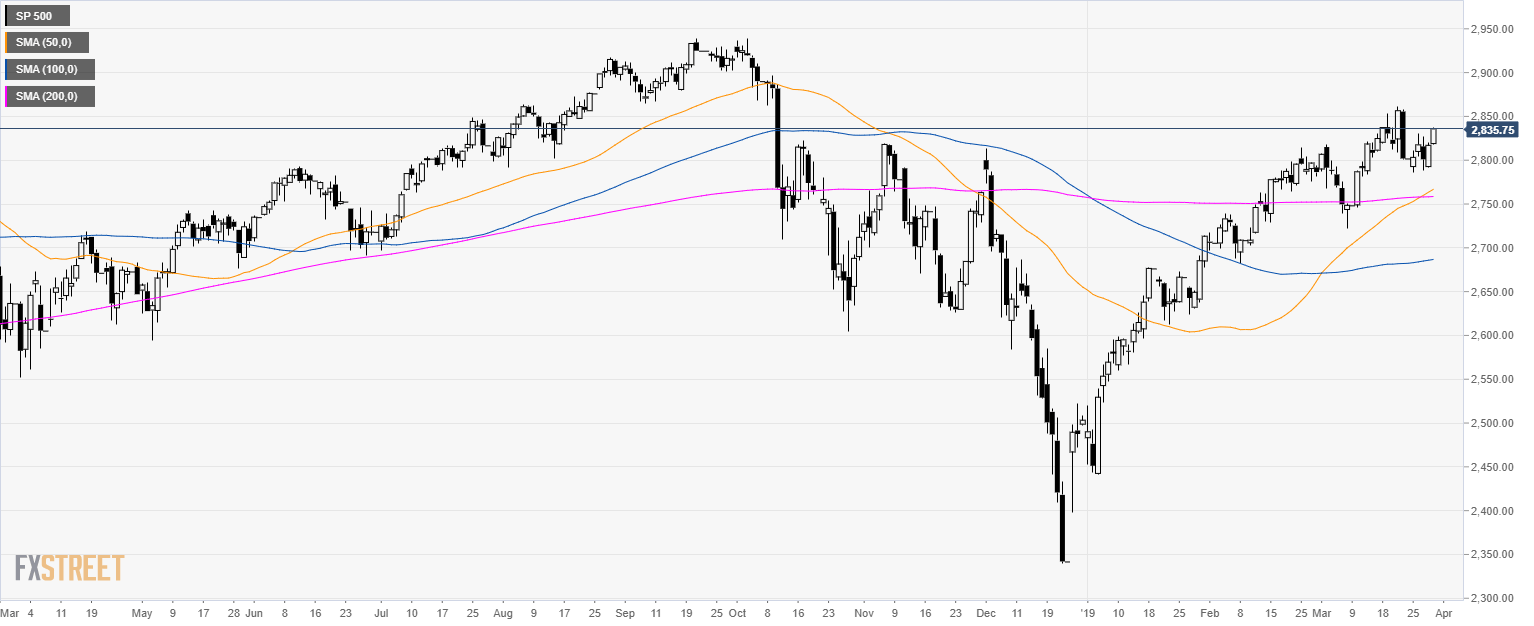
S&P500 daily chart
- The S&P500 is trading above its main simple moving average suggesting bullish momentum.

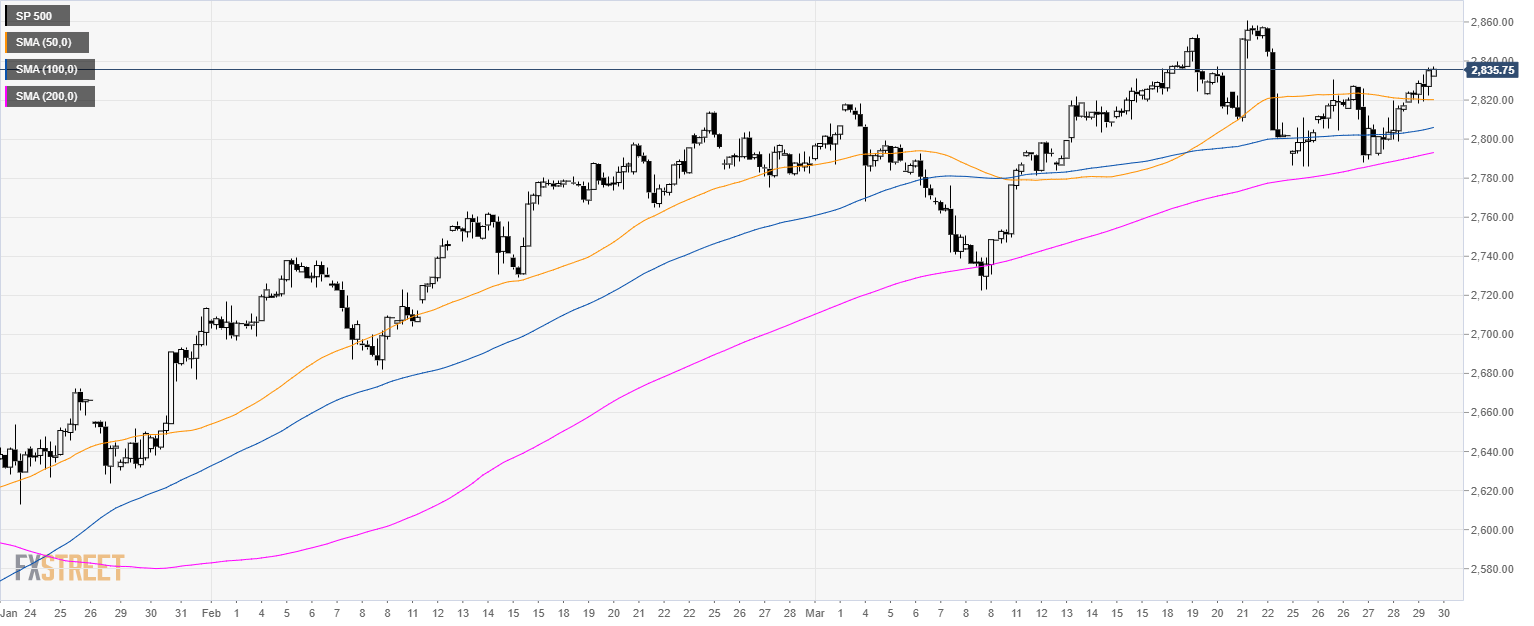
S&P500 4-hour chart
- The S&P500 is trading above its main SMAs suggesting a bullish bias in the medium-term.

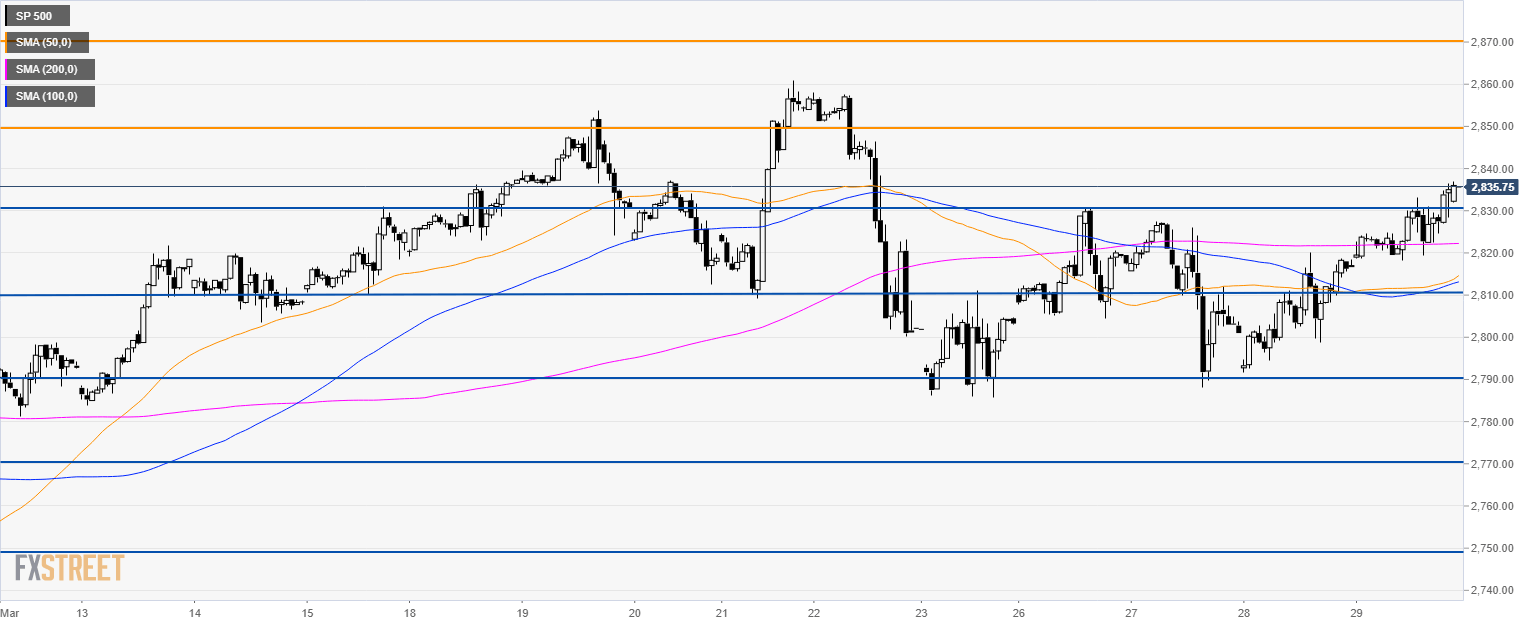
S&P500 60-minute chart
- The S&P500 is trading above its main SMAs suggesting bullish momentum in the short-term.
- The break above 2,830.00 can drive the market to 2,850.00 and 2,870.00 resistance.
- To the downside, support is at 2,810.00; 2,790.00 and 2,770.00 level.

Additional key levels
