USD/CAD Technical Analysis: Greenback at multi-month lows against CAD
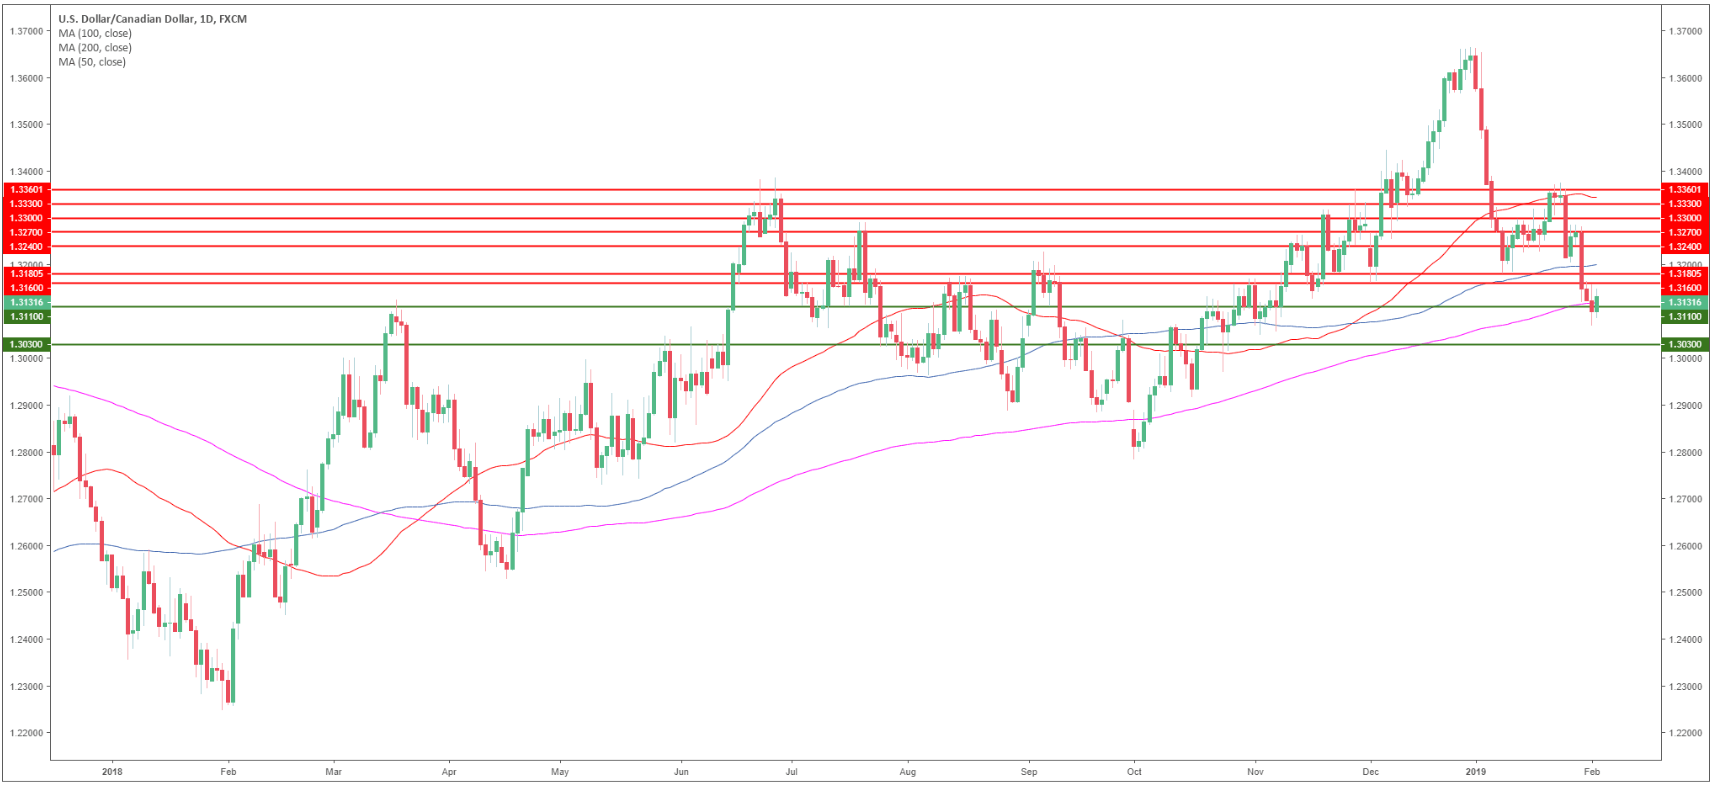
USD/CAD daily chart
- USD/CAD is having a deep pullback near the 200-day simple moving averages (SMAs).
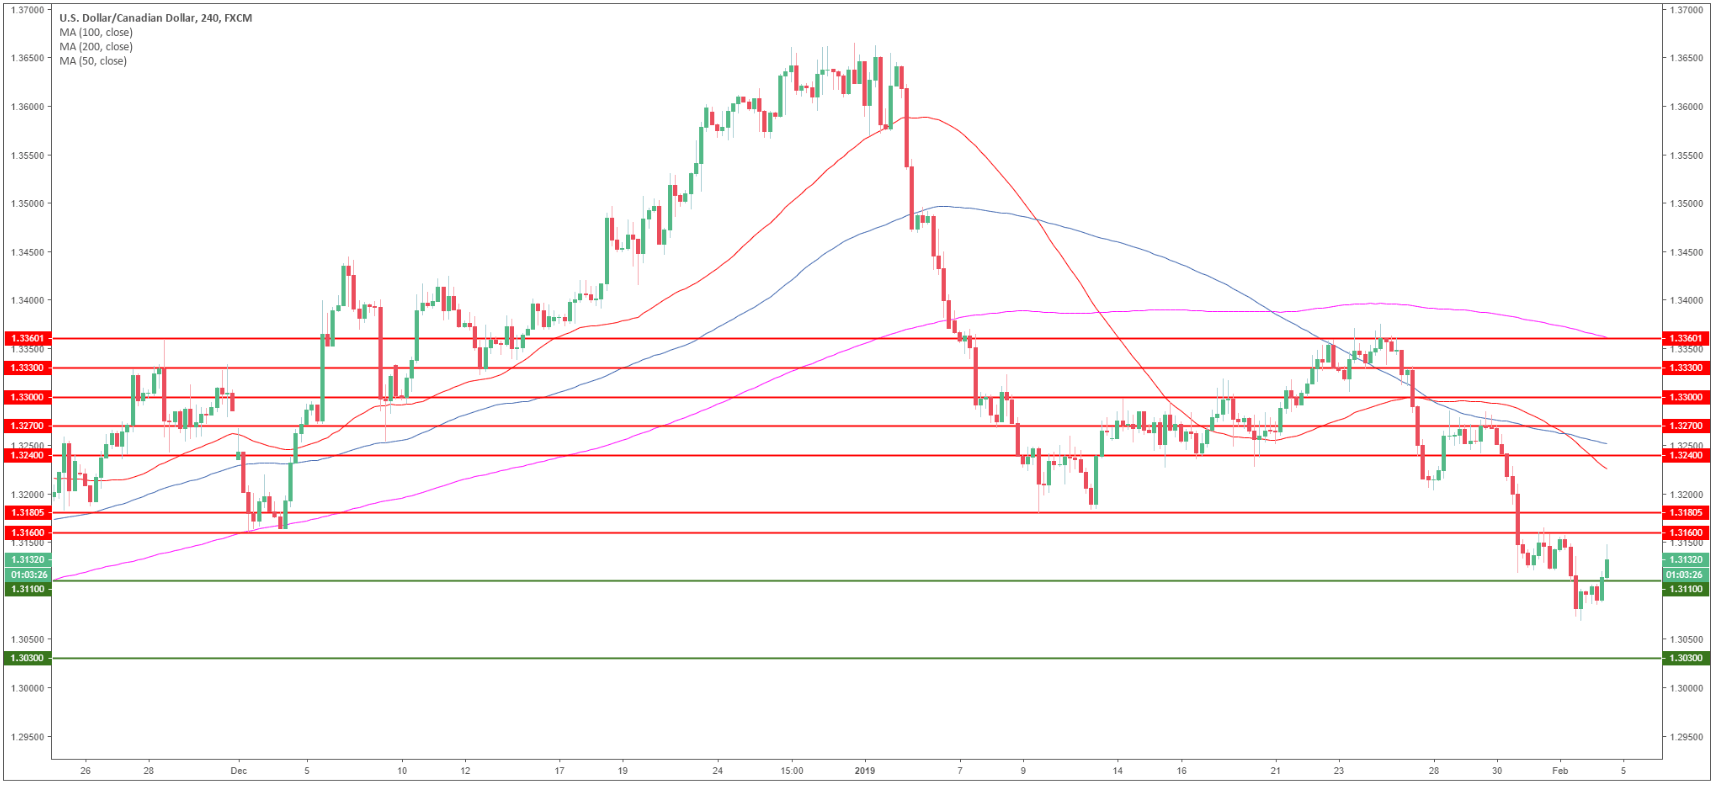
USD/CAD 4-hour chart
- USD/CAD is trading below its main SMAs suggesting bearish momentum in the medium-term.
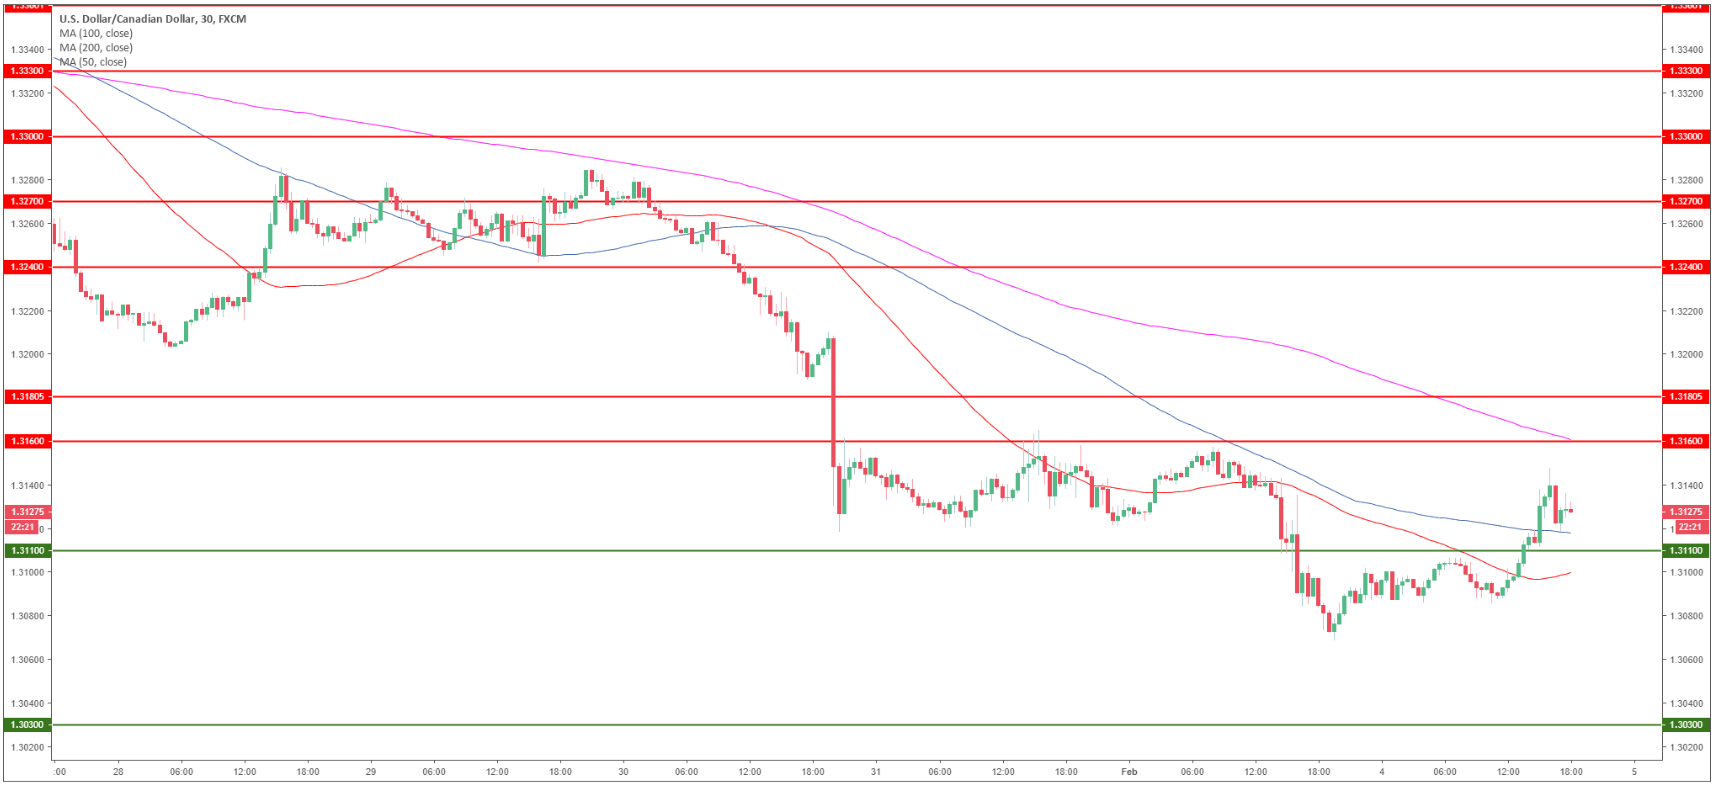
USD/CAD 30-minute chart
- USD/CAD is having a small rebound this Monday, but bulls have a lot of work to do if they want to retake control of the market.
- The 1.3160 level along with the 200 SMA will be an interesting resistance to look at for a potential break above.
- On the flip slide, bears will try to break below 1.3110 in order to bring the market down to the 1.3030 level.
Additional key levels
USD/CAD
Overview:
Today Last Price: 1.3128
Today Daily change: 42 pips
Today Daily change %: 0.32%
Today Daily Open: 1.3086
Trends:
Daily SMA20: 1.3257
Daily SMA50: 1.3374
Daily SMA100: 1.3218
Daily SMA200: 1.3129
Levels:
Previous Daily High: 1.316
Previous Daily Low: 1.3069
Previous Weekly High: 1.3287
Previous Weekly Low: 1.3069
Previous Monthly High: 1.3664
Previous Monthly Low: 1.3118
Daily Fibonacci 38.2%: 1.3104
Daily Fibonacci 61.8%: 1.3125
Daily Pivot Point S1: 1.305
Daily Pivot Point S2: 1.3014
Daily Pivot Point S3: 1.2958
Daily Pivot Point R1: 1.3142
Daily Pivot Point R2: 1.3197
Daily Pivot Point R3: 1.3233