Gold Technical Analysis: Yellow Metal getting ready to pop to $1,246.00/oz
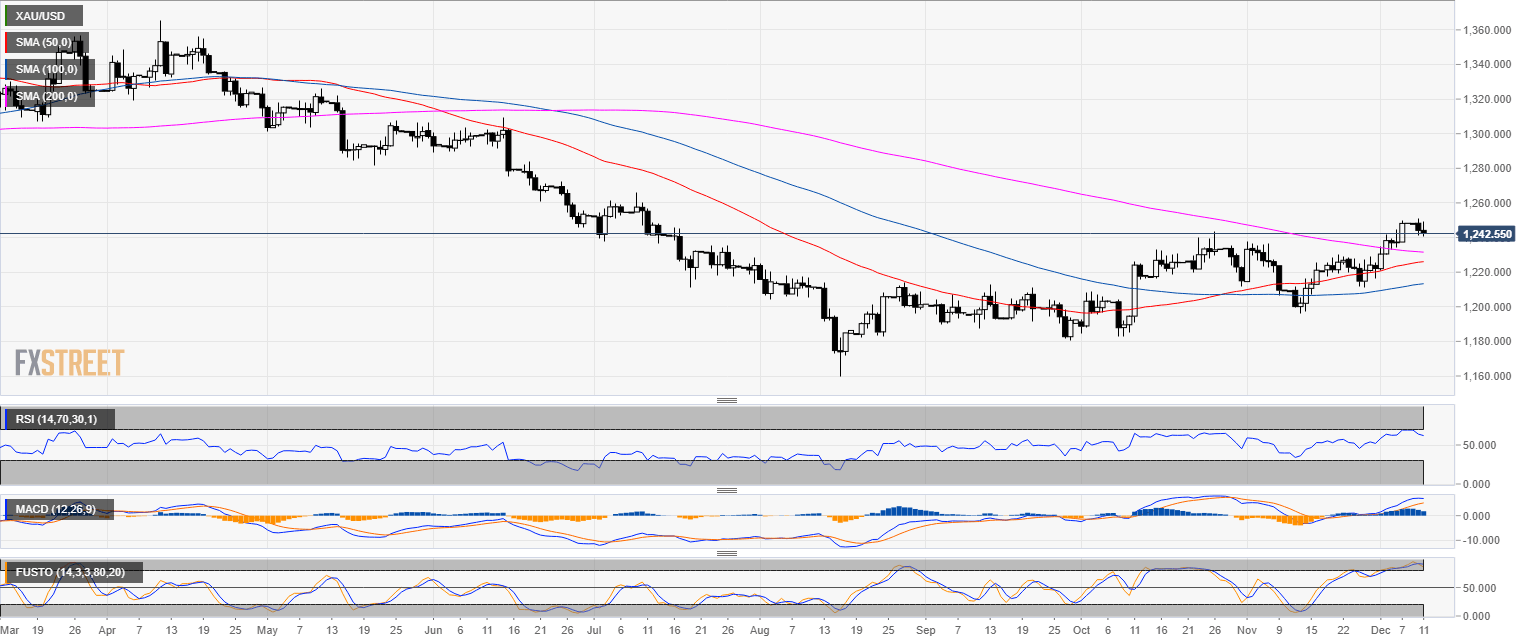
Gold daily chart
- Gold is trading above the 200-day simple moving average.
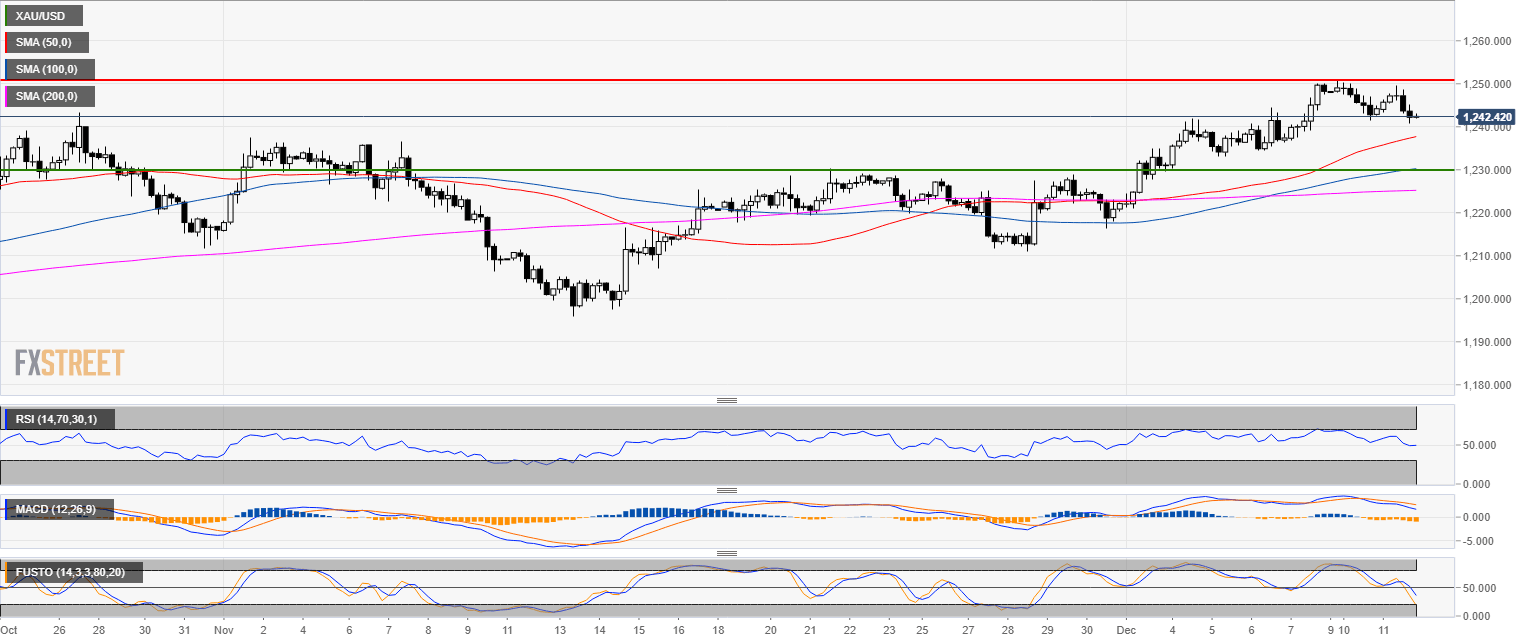
Gold 4-hour chart
- The momentum is bullish as the yellow metal is trading above the 50 SMA.
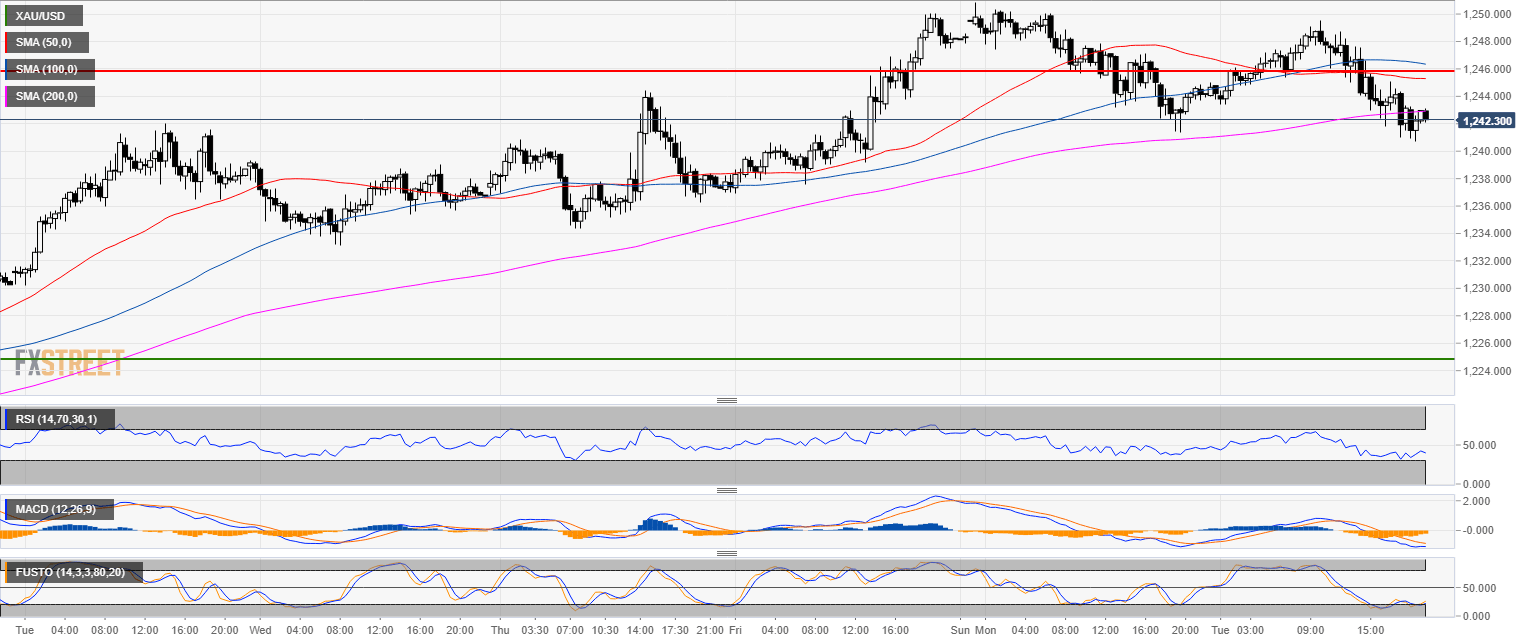
Gold 30-minute chart
- Gold is finding some support at the 200 SMA.
- The bull target can be near $1,246.00 a troy ounce.
Additional key levels
XAU/USD
Overview:
Today Last Price: 1242.5
Today Daily change: -1.8e+2 pips
Today Daily change %: -0.148%
Today Daily Open: 1244.34
Trends:
Previous Daily SMA20: 1226.37
Previous Daily SMA50: 1224.54
Previous Daily SMA100: 1211.92
Previous Daily SMA200: 1232.22
Levels:
Previous Daily High: 1250.85
Previous Daily Low: 1241.8
Previous Weekly High: 1250.1
Previous Weekly Low: 1221.39
Previous Monthly High: 1237.4
Previous Monthly Low: 1196.4
Previous Daily Fibonacci 38.2%: 1245.26
Previous Daily Fibonacci 61.8%: 1247.39
Previous Daily Pivot Point S1: 1240.48
Previous Daily Pivot Point S2: 1236.62
Previous Daily Pivot Point S3: 1231.43
Previous Daily Pivot Point R1: 1249.53
Previous Daily Pivot Point R2: 1254.71
Previous Daily Pivot Point R3: 1258.58