Back
25 Jul 2018
Gold Technical Analysis: Clears a descending trend-line hurdle and 200-hour SMA
• The precious metal regained positive traction on Wednesday and is now holding comfortably above a short-term descending trend-line resistance.
• With short-term technical indicators gaining positive momentum, a follow-through up-move beyond 200-hour SMA adds credence to the bullish breakout.
• Hence, an extension of the positive momentum, led by some fresh technical buying, now looks a distinct possibility.
Gold 1-hourly chart
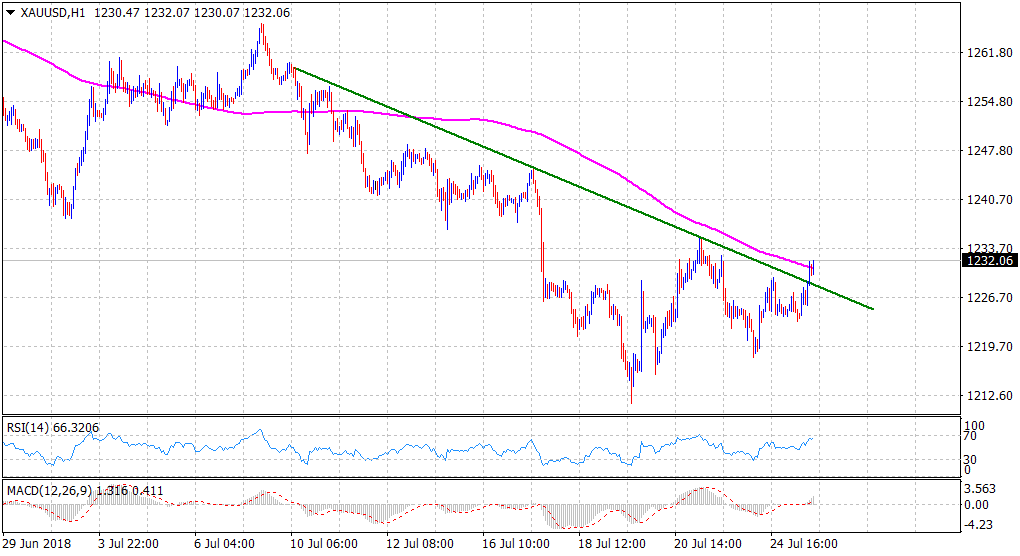
Spot rate: $1232
Daily Low: $1223
Trend: Bullish
Resistance
R1: $1235 (weekly tops set on Monday)
R2: $1242 (20-day SMA)
R3: $1248 (horizontal zone)
Support
S1: $1227 (horizontal zone)
S2: $1223 (recent daily closing low)
S3: $1218 (overnight swing low)