GBP/USD 1.4300 can be next if stars align next week
- GBP/USD can break 1.4000 and reach 1.4300 according to ING.
- The Federal Reserve is most likely to pull the trigger next week.
The Cable is trading at around 1.3935 virtually unchanged on the day while earlier in the US Session, US industrial output data came stronger than expected 1.1% vs 0.3% consensus while JOLTS job openings in January came at 6.312m vs 8.890m expected. The Michigan consumer sentiment index came in at 102.0 vs 99.3 consensus which boosted the USD which saw a strong breakout in the Dollar index which rose from 89.90 low to 90.37 high in the US session to stabilize at 90.20 at the time of writing.
Next week is certainly going to be an important one for the GBP and USD alike, with the Fed expected to hike interest rates, the Bank of England meeting, UK macro data and last but not least the conclusion of the trade deal between the European Union and the United Kingdom. Traders should be expecting great volatility ahead especially in the GBP/USD. Analysts at ING expect the pair to grow in value if the Brexit deal has a positive conclusion, the main sticking issue is the Irish border though. According to analysts, if the Brexit transition deal comes out a success, the Bank of England maintain a hawkish stance and if the UK wage inflation data is constructive, then 1.4000 should be broken to the upside and bulls will be targetting the 1.4250-1.4300 year’s high.
GBP/USD daily chart
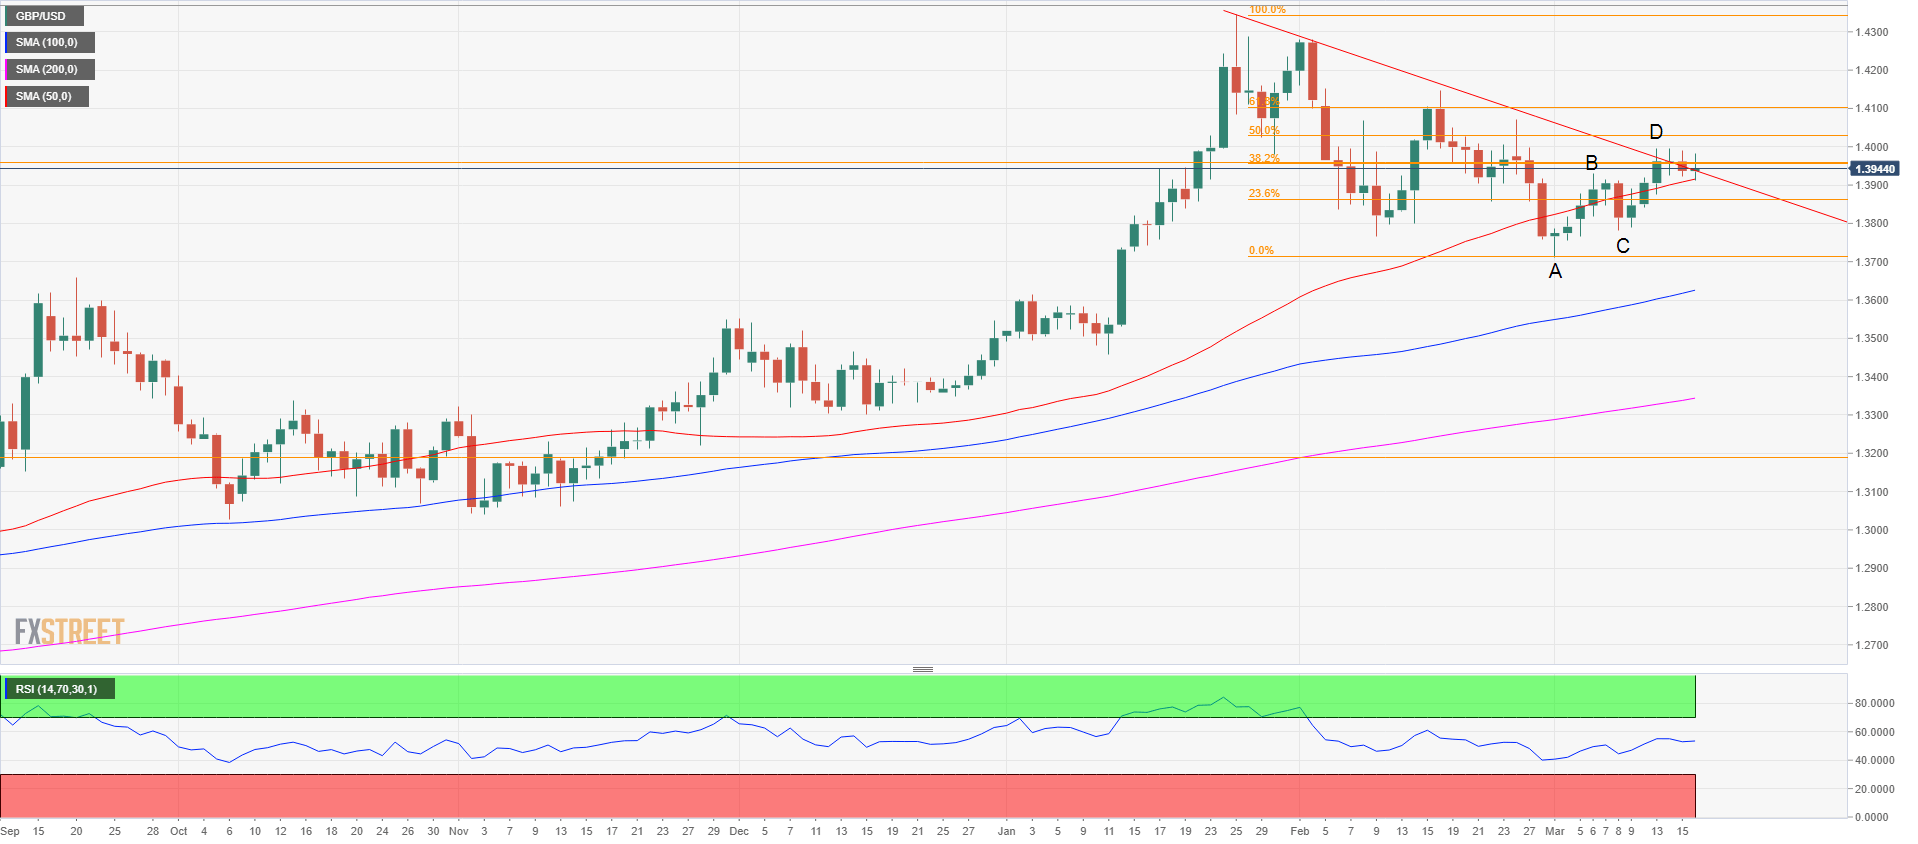
The Cable is trying to find support at its 50-period simple moving average as for the last three days, the market has been compressed between the 50 SMA and the 1.4000 level. The Pound managed to break above the bearish trendline but the bull attacks have all failed so far leaving wicks on top of bars, implying that bulls couldn’t close the bar at the top. After two legs up, the ABCD pattern, the GBP/USD is struggling to break above 1.4000. A strong bear breakout below 1.3900 psychological level suggests a pullback to 1.3800 ‘B’ point, followed by 1.3700 ‘A’ point which was the start of the two-legged pattern. If buyers manage to breakout above 1.4000, then 1.4100 handle is in the cards with the 61.8% Fibonacci retracement from the December 25-March 1 bear leg, followed by 1.4300 figure close to the high of the year.
GBP/USD 15-minute chart
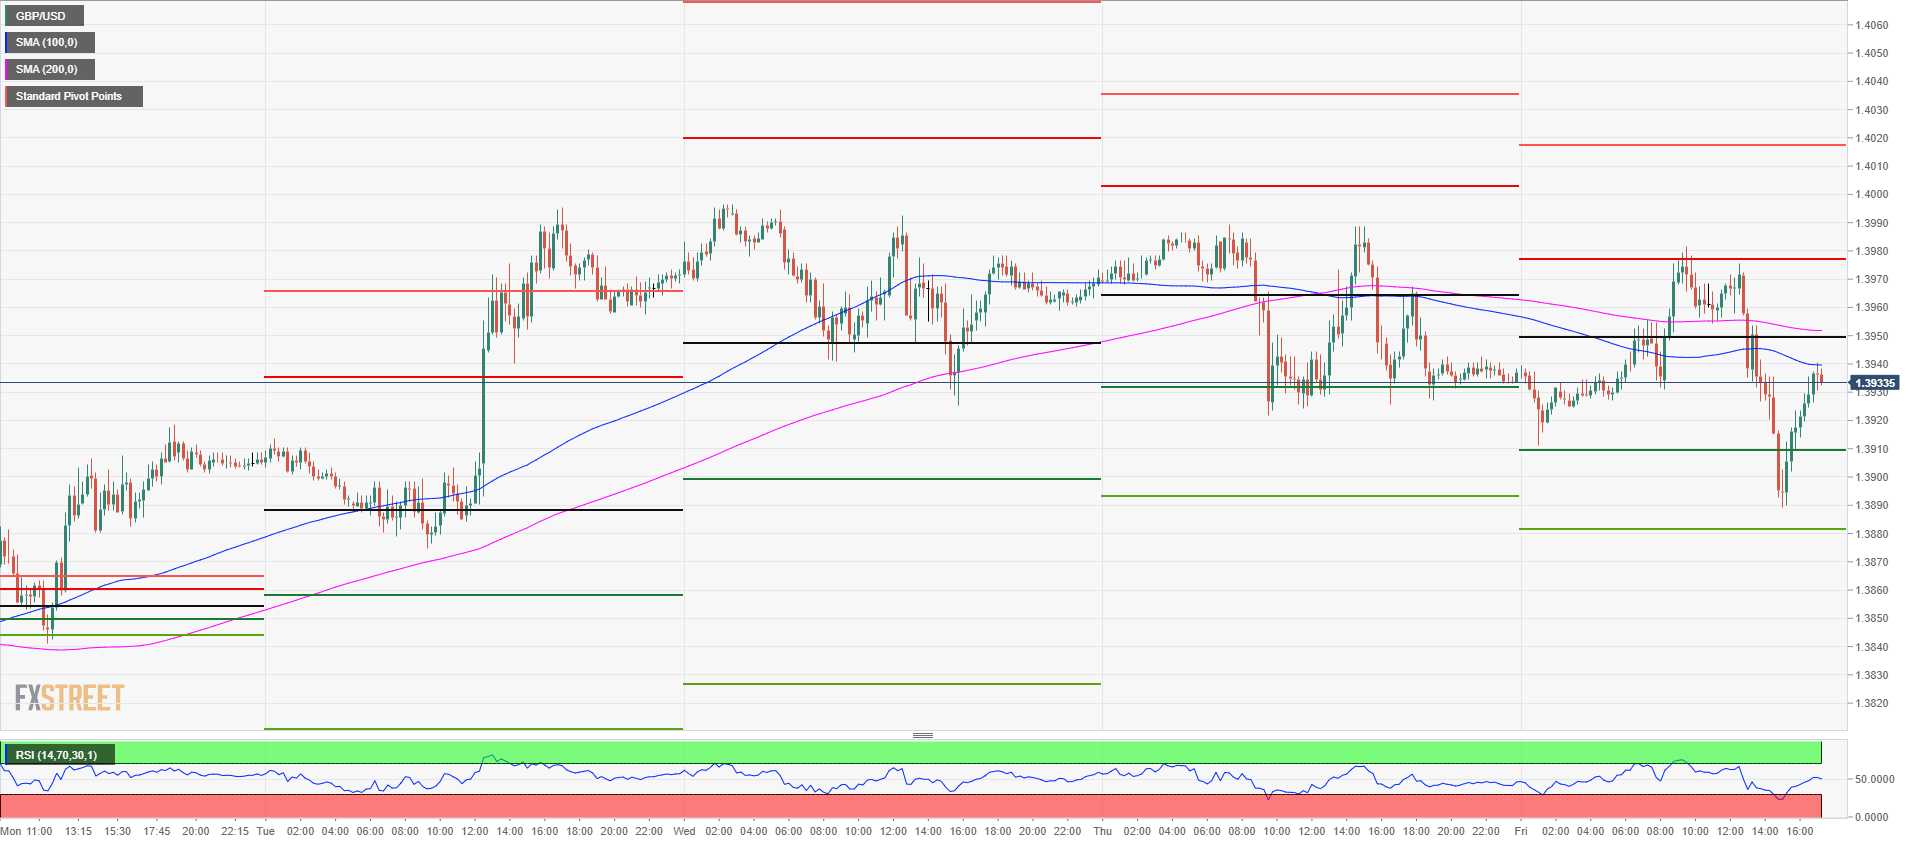
The market found intraday resistance close to the 1.3880 level after a decline from the 1.3980 resistance. Resistance is now seen at the 1.3950 daily pivot with both the 100 and 200 SMA barrier, higher up there is the 1.3980 resistance which was the high of the day. Support is seen at 1.3910 S1 pivot and 1.3880 S2 pivot.