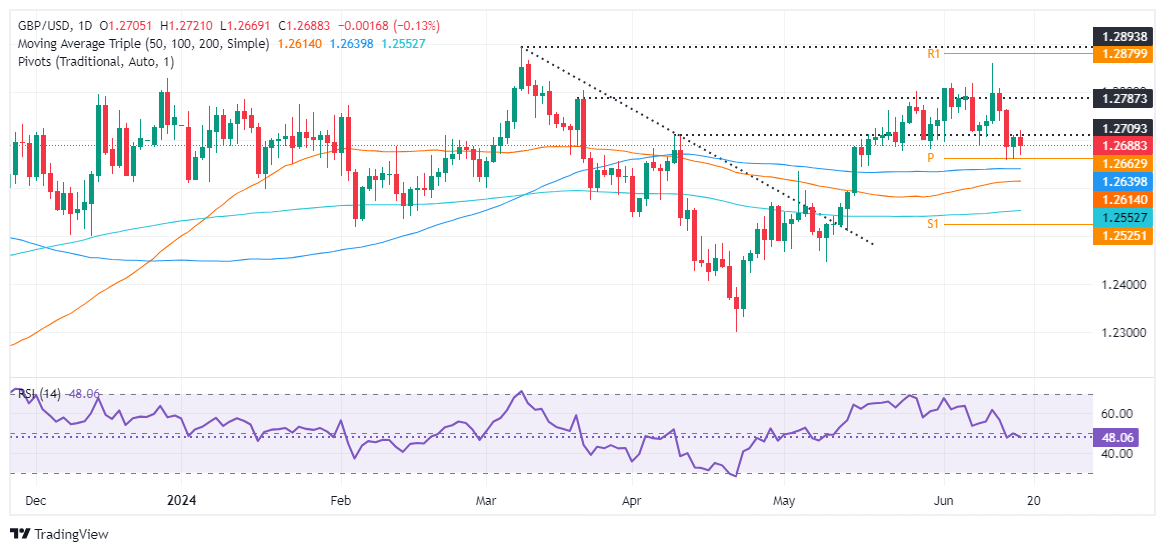
GBP/USD Price Analysis: Remains bearish, falls below 1.2700
- GBP/USD trades below 1.2700 after hitting a two-day high of 1.2720.
- Resistance at a broken support trendline could lead to further price drops.
- Key support levels: 1.2656 (June 14 low) and 1.2643/34 (100-DMA confluence and May 3 high).
The Pound Sterling creeps lower against the US Dollar on Tuesday, amid a scarce economic docket in the UK following the release of mixed data in the United States. At the time of writing, the GBP/USD trades at 1.2688, down 0.12%.
GBP/USD Price Analysis: Technical outlook
Following a dip to a multi-week low of 1.2656, the GBP/USD has shown signs of resilience, managing to regain some ground. However, it's important to note that it still hovers below a one-month broken support trendline turned resistance, which could potentially lead to further price drops.
Momentum shows that sellers remained unchanged, as revealed by the Relative Strength Index (RSI).
If GBP/USD drops below 1.2700, the exchange rate will continue to fall and face the first support, at 1.2656, the June 14 low. Once cleared, the next stop would be the 100-day moving average (DMA) confluence and the May 3 high at 1.2643/34, ahead of 1.2600.
Conversely, if GBP/USD climbs past 1.2720/30, that could exacerbate a rally toward 1.2800.
GBP/USD Price Action – Daily Chart

